A recent interview by Tyler Cowen of John Arnold has been making the rounds in ed reform circles, see Michael Goldstein’s write up here. Here is a taste of the interview:
Tyler Cowen: There’s a common impression—both for start-ups and for philanthropy—that doing much with K–12 education or preschool just hasn’t mattered that much or hasn’t succeeded that much. Do you agree or disagree?
John Arnold: I agree. I think the ed reform movement has been, as a whole, a significant disappointment. I think there have been isolated pockets of excellence. It’s been very difficult to learn how to scale that. I think that’s largely true of many social programs or many programs that are delivered by people to people, that you can find a single site that works extraordinarily well because they have a fantastic leader, and that leader might be able to open up a few more sites. But then, when you start to scale it to 50 sites, and start to go across the nation, it all mean-reverts back to what the whole system is providing.
“We’re a dispirited rebel alliance of do-gooders,” Goldstein writes gloomily, but the underlying premises deserve scrutiny, as it strikes me as entirely too pessimistic. Let us for instance look at the academic growth rates for charter schools in Arnold’s home state of Texas as recorded by the Stanford Educational Opportunity Project. Each dot is a Texas charter school, and green dots on or above the zero line display an average rate of academic growth at or above having learned one grade level per year:

This chart deserves a bit of your time to marvel at. While receiving far less total taxpayer funding per student, the Texas charter sector has not only created a large number of schools with high academic growth, but they also place competitive pressure on nearby district schools to improve their academic outcomes. Texas charter schools have not cured the world’s pain, nor have they dried every tear from our eyes. It is hard for me, however, to view it as anything other than a tremendous academic success, and Texas is not alone. Here is the same chart for charter schools in Arizona:
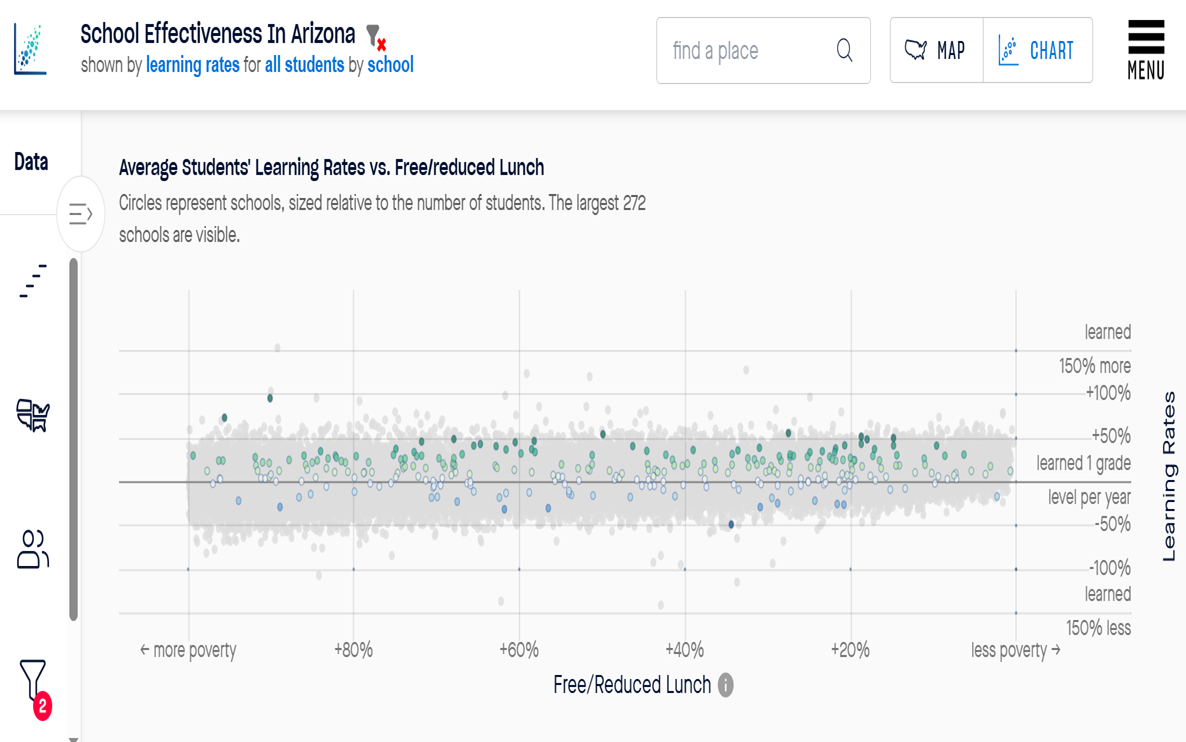
Again, we see far more high academic growth green-dot schools than low academic growth blue-dot schools. Once again, this sector is a bargain for taxpayers, and the sector placed competitive pressure on districts to improve. By the way, Arizona has a larger number of charter schools in low-poverty areas than Texas. That helped crack open high-demand district schools to open enrollment, which is why a real Fresh Prince can go to school in Scottsdale but not in Bel Air or Highland Park in Texas, which opened a vast new supply of choice seats in school districts. The do-gooder rebel alliance, it turns out, made a serious political and educational error when they effectively in a variety of ways excluded suburban areas.
You live and (hopefully) learn. Speaking of Bel Air, behold the magnificence of the academic growth of California’s charter school sector:

Oh, and then there is the 2024 NAEP to consider:

If you do not live in a state whose name starts and ends with the letter “o” you are likely to be happy with your charter sector’s performance vis-à-vis districts, which admittedly, is a low bar. Of course, all this data is messy and neither the growth measures developed by Stanford nor the NAEP proficiency data above capture long-term outcomes- such as do schools produce good and productive people who are well-prepared to exercise citizenship. We are looking through a glass darkly.
The do-gooder education reform alliance should indeed take stock of which efforts produced meaningful results, and which proved to be costly quagmires, and recalibrate their efforts accordingly. To paraphrase the Bard: the education reform movement has 99 problems, but the inability to scale success in choice programs ain’t one.
 Education choice critics often claim that choice will harm students remaining in public schools. Florida students with disabilities have had fully funded access to private choice programs on a statewide basis since 2001, and to charter schools since 1996. Florida’s students with disabilities have thus had much greater access to choice over a longer period of time than most student populations.
As demonstrated below, Florida’s students with disabilities have made sufficient academic progress to overtake not only students with disabilities nationally, but other national subgroups, and indeed the averages for all students in multiple urban districts and a handful of statewide averages.
Florida lawmakers created the nation’s first choice program for students with disabilities in 1999 – the McKay Scholarship program – which went statewide in 2001. This program was formula-funded and available to any student with an Individual Education Plan. Florida also was an early adopter of charter schools and has one of the nation’s largest charter school sectors.
In 2015, the state created the nation’s second education savings account program for students with disabilities. Florida also launched a thorough effort to improve early literacy for all students during the same period.
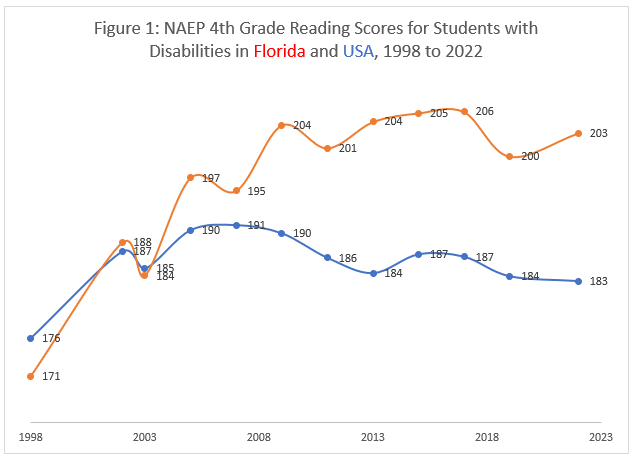
The results have been impressive. In 2022, Florida fourth graders with disabilities demonstrated a level of literacy approximately three grade levels higher than their peers in 1998.
As previously noted, Florida instituted a suite of education reforms in 1999, and we cannot be certain with regards to cause and effect. Florida, for instance, was an early and aggressive adopter of the science of literacy as well as school choice.
Florida’s progress for students with disabilities has not been limited to reading, and if the theory is that choice harms student outcomes, Florida’s students with disabilities make for as good a test as any.
It’s also possible that Florida students with disabilities exiting the public-school system through private choice programs increased public school averages. To do so at scale, the average academic performance of those exiting would need to be unusually low compared to those remaining in the public-school system, and the participation rate relatively high.
The participation rate in Florida’s choice programs of students with disabilities averaged below 10% of eligible students for the period covered. While there is a large academic literature demonstrating positive competitive effects from choice programs on public school outcomes, academic selection bias seems unlikely to have had a large impact on statewide scores.
When examining Figure 1, note that the 1998 to 2003 progress in Florida was sufficient to push and keep Florida’s scores for students with disabilities above the national average. Unlike the national trend, Florida’s scores continued to improve while those nationally stagnated and declined.
Nationally, Black students have had far less access to K-12 choice than Florida’s students with disabilities. Only a small minority of Black students have access to private choice programs, with greater access to charter schools. The supply of charter school seats, however, varies widely by state, with many states having either few charter seats or long waitlists at charter schools. Florida’s students with disabilities have access to both an unusually large charter school sector and formula funded private choice programs.
Figure 2 compares the trend in fourth grade reading scores among Florida’s students with disabilities with that of Black students nationally.
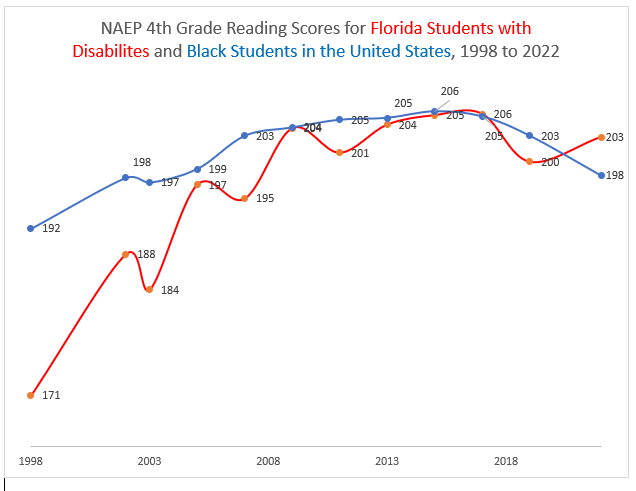
Florida students with disabilities first tied the national average for Black students in 2009, effectively did it again in 2015 and 2017, and then put some distance between their scores in 2022. In 2022, only eight states had statewide averages for Black students higher than Florida’s statewide average for students with disabilities.
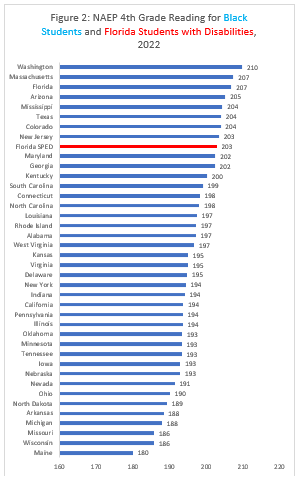
Florida’s average fourth grade reading score for students with disabilities not only exceeded the average score for all students in several of the large urban districts; it also exceeded the average score for all students in New Mexico – the lowest-performing state – in 2022.
Note that this trend is not limited to the NAEP fourth grade reading exam, nor to Black students. In 2022, Florida students with disabilities had fourth grade math scores equal to or greater than those for all students in three states, Alaska, West Virginia, and New Mexico.
On eighth grade reading, Florida students with disabilities matched or beat the average scores for all students in five NAEP Trial Urban District Assessments, Detroit, Cleveland, Milwaukee, Baltimore and Dallas). On eighth grade mathematics, Florida students with disabilities edged out the average for all students in Detroit.
We can draw multiple conclusions from these results, both positive and negative. Let’s hit the positive first.
Florida’s improvement in the scores of students with disabilities strikes yet another blow against education fatalism. Florida also improved outcomes for other student subgroups holding the short end of various achievement gap sticks. Bravo Florida.
On the negative side, student warehousing seems alive and well around the country. The National Institute of Health defines a learning disability as “disorders that affect the ability to understand or use spoken or written language, do mathematical calculations, coordinate movements, or direct attention.”
Neither a student’s skin color, nor living in New Mexico, nor attending school in a large urban school district remotely qualifies as a learning disability. NAEP scores should reflect that.
It lies beyond the power of your humble author to prove that access to choice programs helped drive the extraordinary gain in achievement among Florida students with disabilities detailed above. You’ll have to decide for yourself whether it is likely that these gains happened in spite of an unusually high choice exposure.
Color me skeptical.
 The National Assessment of Educational Progress (NAEP) released “the nation’s report card” recently, which included fourth and eighth grade Math and Reading results for 2022. The results can only be described as devastating.
 Closing the achievement gap between Black and white students has long served as an aspiration of the education reform movement, but gap closing is a problematic concept. States can – and have – closed gaps as evidenced by NAEP scores by having all students do worse over time, but relatively advantaged groups decline at a faster rate.
This is in no way desirable; it’s best to focus on gains for disadvantaged students.
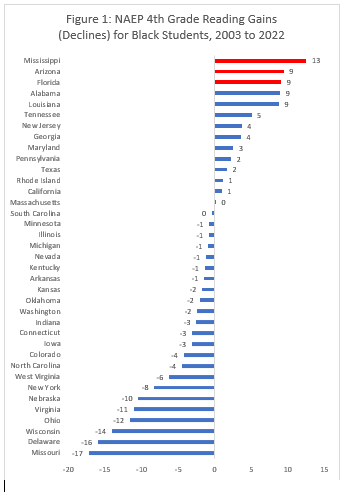
The chart above shows the academic trend from 2003 (the year all states began taking NAEP exams) to the most recent exams in 2022 for fourth grade reading for Black students. Note that on this test, 10 points roughly equals a grade level of average progress.
Mississippi shows admirable nation-leading progress; I have highlighted the top three performers (Mississippi, Arizona and Florida) purposefully.
Mississippi’s literacy strategy has been rightly and broadly praised. The main thrust of Arizona’s education reform strategy, meanwhile, involves the promotion of school choice. Arizona has adopted other reforms like school grading and third grade retention, but these strategies have been poorly executed, with grades getting turned on/off repeatedly and lacking surface credibility, and a third grade literacy gate that is wide open to illiterates to proceed (vanishingly few students retained).
The chart below shows the fourth grade reading trend for Black students between 1998 and 2022.
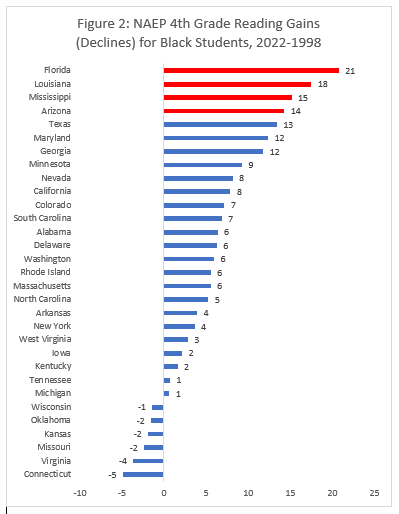 Backing the clock up to just before Florida’s election of Gov. Jeb Bush shows the state’s combined strategy (choice and literacy) is far out in front in driving gains. Note also that Louisiana, another state with a combined strategy, jumps into second place in the 1998 to 2022 chart.
As the kids say, game recognizes game. Choice and literacy strategies are not mutually exclusive, and in fact, each strategy can mutually reinforce the other.
 It’s award season here at reimaginED, and we’re reviewing a trend from “the Nation’s Report Card” for low-income students who tested in all 50 states between 2003 and 2022 on the fourth grade Reading exam. Basically, you want to see your state on the right side of the zero line on this chart that plots the literacy trend against a spending increase per pupil.
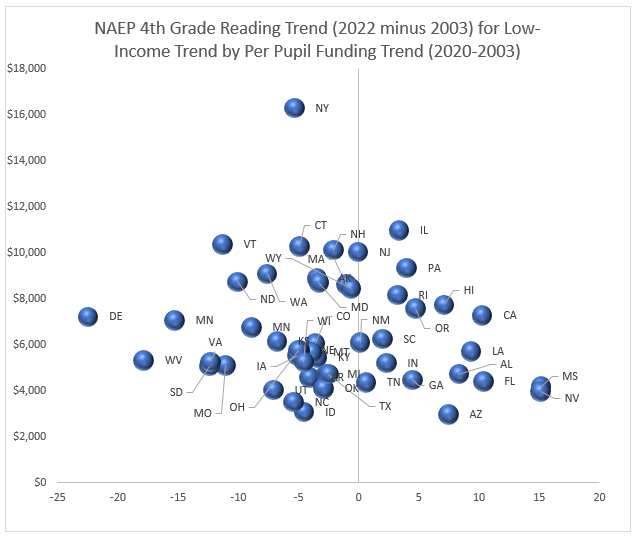 So based on this chart, which states are getting shortchanged the most by their public-school systems?
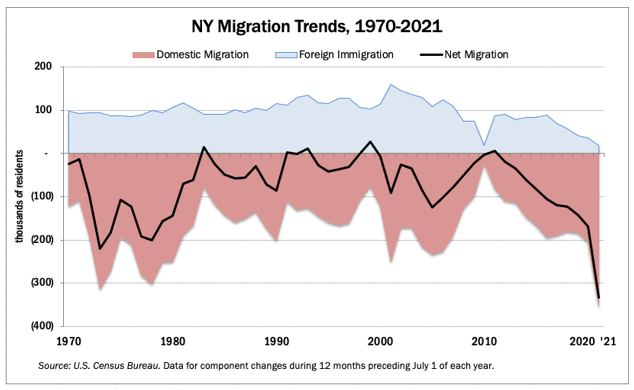
New York sticks out like a sore thumb on the spending side. New Yorkers ought not bother making “Oops, we catastrophically mishandled the pandemic” lame excuses because the state was to the left of the zero line in 2019.
Far from being the result of sort of unfortunate accident, the data reflects the outcome of policy preferences of the United Federation of Teachers and the various politicians they routinely influence.
Delightfully, the American founders created a system with federalism and New Yorkers have been fleeing, mostly to Florida.
 Florida is one of a cluster of states that increased spending by a relatively small amount (about one-quarter of the New York increase) but saw relatively large reading gains for low-income students on NAEP. Other states include Alabama, Arizona, California, Hawaii, Louisiana, Mississippi and Nevada.
Pennsylvania appears to be the only state in the northeast to eke out any kind of increase, and the improvement is dominated by states in the south and the west.
The first chart badly shortchanges Florida because the state’s improvement started after 1998 (before all states took NAEP). The increase for low-income students between 1998 and 2022 amounts to an astounding 25 points, meaning the average low-income fourth grader in Florida read more than two grade levels higher than their peers in 1998.
Ultimately, though, Delaware’s academic catastrophe is simply too powerful to ignore: a 22-point decline in fourth grade reading scores for low-income students. Poor students already were showing a grade level lower performance in 2019 than in 2003, but the state managed to double up on that decline in the space of three years to bumble to a two academic year level of decline.
West Virginia and Minnesota tried to provide competition, but ultimately Delaware is the “winner” of the 2022 NAEP most pathetic literacy performance award.
 Editor’s note: This commentary from former Florida Gov. Jeb Bush, founder and chairman of ExcelinEd and ExcelinEd in Action, appeared last week on wsj.com.
While much of the U.S. has returned to normal after the pandemic, the long-term academic harm to students endures.
This school year is the first time many public-school students returned to in-person learning without mask requirements or learning disruptions. That’s nearly 2½ years since the beginning of the pandemic. For younger children, that’s 25% or more of their lives so far.
Since March 2020, we’ve seen the largest learning loss in modern history. This catastrophe wasn’t inevitable. But what began as school closings in response to COVID-19 morphed into an intentional effort by teachers unions to block the schoolhouse door. On Monday, the 2022 National Assessment of Educational Progress scores will be released, and they are likely to be appalling.
(Editor’s note: You can read about the results here.)
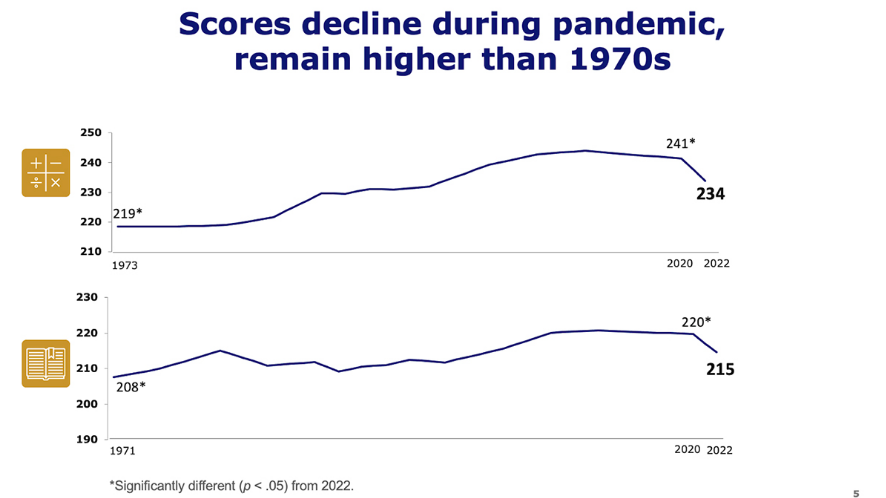
This congressionally authorized 50-state analysis, officially styled the Nation’s Report Card, will show exactly how much U.S. students have fallen behind. Last month, the NAEP long-term trend assessment was released. That report found that between 2020 and 2022, average reading scores for 9-year-olds declined 5 points, nearly half a grade level, and math scores dropped 7 points, more than half a grade level. This is the greatest average score decline in reading since 1990, and the first ever score decline in mathematics.
The U.S. has a choice: Give up on a generation or confront this challenge head-on.
Some adults find it easier to give up. They won’t say it out loud; they’ll simply lower expectations. Or, they’ll explain away the drop in scores, blaming the pandemic when scores had already begun to decline before Covid hit. Rather than raise the bar, they’ll dodge accountability, allowing today’s low math and reading scores to become tomorrow’s ceiling.
That is unacceptable.
We can move forward rather than back. Doing so is a priority if the U.S. is to be a competitive nation in a competitive world. It also is a human necessity, as every student has God-given potential and deserves a great education.
The solutions are simple. There are math and reading policies every state should immediately enact and there are ways parents can contribute. Start with a call to all parents, guardians, and families—those who know their children best. You were called on to step up when Covid kept kids at home. Now you are needed again to help close those learning gaps.
Any trusted adult in a child’s life—parent, grandparent, uncle, aunt, whoever—should lean into this moment. Help students recover lost learning by reading for 20 minutes a day. That can be a parent reading to a child, a child reading to a parent or children reading to themselves. In addition, research has found that 30 minutes a week of extra math work can help students who are struggling or behind. If you aren’t up to writing math equations for your kids, seek out free, high-quality online math tools.
Lawmakers must step up, too. One way to help parents is eliminating the barriers students face in accessing a better education. This year, Arizona became a national model by creating a universal education savings account program with flexible, portable and customizable funding. That kind of legislation is transformative for student learning.
Early literacy is the foundation for long-term reading success. To ensure every child can read by the third grade and be ready to succeed in life, policy makers must ensure that all educators are trained in phonics and the science of reading—an evidence-based approach to teach the understanding of sounds, decoding, fluency, vocabulary and comprehension. This may require changing teacher-prep programs in colleges of education as well as installing literacy coaches in every elementary and middle school.
Literacy practices and curricula that fail to teach students how to decode words should be banned. Teaching models that include the “3-cueing” approach, which asks students to look at pictures and guess instead of sounding out words, should be scrapped. It’s a failed approach.
Every state should require that students be screened in reading three times a year in grades K-3 and offer assistance to those struggling to learn to read. These critical years are too often ignored until it’s too late to catch up.
The same is true for math instruction. States should ensure that students have access to trained, effective math teachers. That may mean not all elementary teachers should teach math, only those who specialize in it.
Students graduating from high school should have mastered at least Algebra I. Curriculum should have high-quality content focused on procedural and conceptual problem-solving skills and knowledge of whole numbers, fractions and geometry. Students who are behind need personalized math support, including tutoring two to three times a week.
Overcoming the pandemic-related education crisis is possible. For the next generation, we must abandon failed practices, rally around education excellence, and commit to helping children reach their full potential.
 State-level NAEP results and Halloween both are coming soon, on Oct. 24 and Oct. 31, respectively. The first should be far more frightening than the latter.
I’m not much of a horror movie fan, but I recall watching about 3 minutes of the 1988 flick Child’s Play. I saw a psycho knife-wielding murder doll named Chucky trying to stab and bash his way past a door held shut by a terrified middle-aged woman and an equally terrified young boy.
“Give me the boy!” Chucky screamed, “GIVE ME THE BOY AND I’LL LET YOU LIVE!!!!” (You can watch the scene here, but I don’t recommend it.)
I can’t tell you what happens next, because I turned it off and tried to put it out of my mind. Nevertheless, the scene does make for a rather apt analogy for what happened during and before the COVID-19 pandemic.
The 2022 NAEP will simply serve as the latest confirmation.
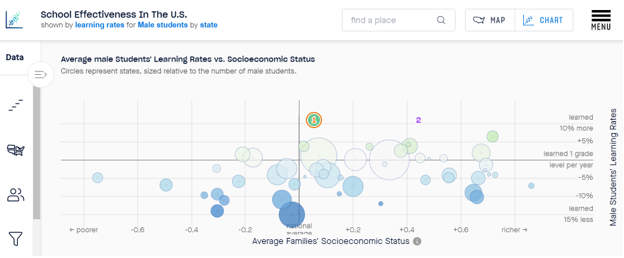
The Educational Opportunity Project at Stanford University tracked learning rates by gender and state for (currently) the 2008-18 period for grades 3-8. What you see above is the project’s scatterplot for that data.
Arizona and Alaska tied for first place with a rate of academic growth 10.9% above “learned 1 grade level per year.” Notice the large amount of blue (not good) and the relative scarcity of green.
Not to jump to any hasty conclusions, but what we are doing doesn’t seem to be working out for boys.
Every indicator I’ve seen thus far leads me to expect that this will look much worse when we get to the post-pandemic data. For example, in the national Long-Term Trend math NAEP data for 9-year-old Black boys, the 2022 scores rolled all the way back to 1992.
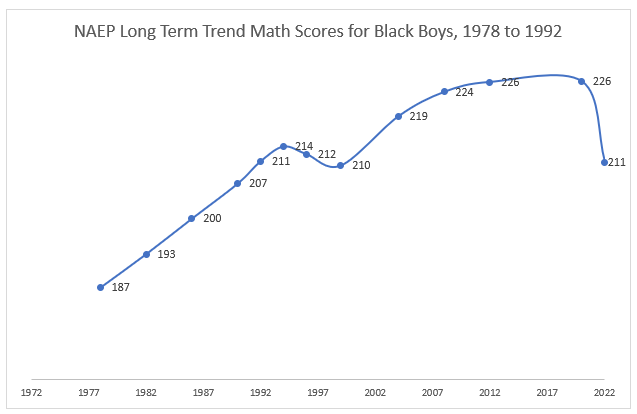
Let’s see how this looks in the state data release next week. I’m guessing the outcomes will be noticeably varied, as some jurisdictions did a much better job of holding the door than others.
Stay tuned to this channel for further updates.
Editor’s note: This commentary from Paul E. Peterson, a senior fellow at the Hoover Institution and a member of the Koret Task Force on K-12 education, appeared last week on thehill.com. You can read a reimaginED post about private school enrollment growth in Florida here.
The National Assessment of Educational Progress has just reported steep drops in student achievement at the nation’s public schools. How will parents respond to the news? Is the downward trend in private education enrollments about to be reversed?
Before COVID-19, private school enrollments were headed downhill. Between 1964 and 2019, the percentage of students attending private schools fell from 14% to 9% of all school-age children, an all-time low.
Then, in fall 2020, most public schools kept their doors closed. Only 24% of public school students attended school in person, compared to 60% of private school children, according to Education Next parental survey (which I helped design).
The following May, nearly 80% of private schoolers were in class every day, as compared to only half of those at public schools.
Learning online was not good for students. Parents reported learning losses for 64% of children at public schools but only 43% of children at private ones. Private schools also had greater success in curbing adverse effects on children’s social relationships, emotional well-being and physical fitness.
When they opened, private schools were accused of gambling with their students’ health. Tom Carroll, superintendent of the Catholic archdiocese in Boston, recalls he “started getting letters, people saying, ‘Well, are you going to go to the funeral of every single child that you killed by opening all the schools?’”
Kathleen Porter-McGee, head of a Catholic school network in New York, remembers, “it was a scary time…the fear was palpable.”
When COVID spread at school proved minimal and mild, the private school bet paid off. “From the point [when schools announced closures] to roughly the middle of October, the phones kept ringing,” Carroll recalls. “So we gained about 4,400 students,” Our poll indicates a 2 percent gain in private school share between 2019 and 2022. If the survey is on the mark, it means a shift of 1 million students from the public to the private sector.
To continue reading, click here.
 Back before the 2019 release of the “Nation’s Report Card,” I predicted that somewhere out there in the four tests – fourth grade and eighth-grade Math and Reading – a statewide score for Black students would exceed a statewide score for white students for the first time in the history of NAEP testing.
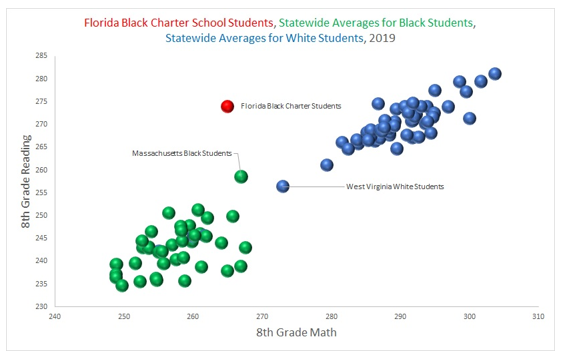
It happened! Black students in Massachusetts narrowly edged out white students in West Virginia this year on eighth grade Reading. Delightfully, Black students attending Florida charter schools clobbered both of them, by the way.
Yes, West Virginia has the lowest scoring white students, and yes, those students are far below average compared their peers, and yes, this is nowhere close to good enough for either Massachusetts Black student or West Virginia white students. Yes, the difference in scores may have been within the margin of sampling error.
Having said all that, this had never happened before in decades of NAEP exams. This was an important milestone in closing achievement gaps.
Last week, NAEP released Long-Term Trend data for 2022. One pandemic goat-rodeo response later, any hope of a statewide sample of Black students closing the gap with any state’s sample of white students is gone.
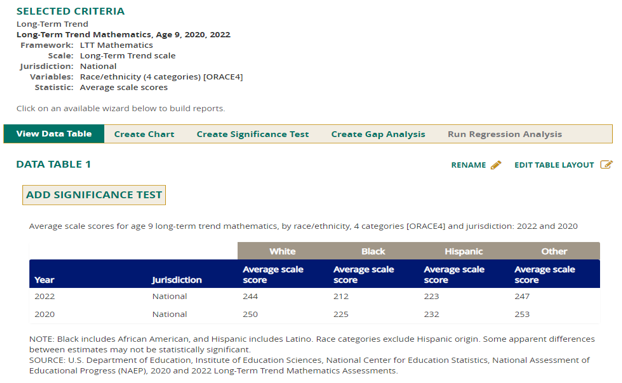 On these exams, 10 points roughly approximates an average year of average academic progress. The national white-Black gap expanded from 25 points in 2020 to 32 in 2022.
Black students lost about twice as much as white students between 2020 and 2022. Higher income families were doubtlessly better situated to compensate for the absence of in-person schooling. The students “left at home with a jar of peanut butter and a spoon and told not to answer the door” appear to be the only group bearing the consequences for decisions they had no voice in making.
Your author fears that no one reading this post will live long enough to see the 2019 milestone reached again. State level NAEP results will be released in a matter of weeks and the full extent of the fiasco will stand revealed.
Stay tuned to this channel.
 Editor’s note: This analysis of long-term scores from NAEP, which show unprecedented score declines, appeared today on The 74.
Two decades of growth for American students in reading and math were wiped away by just two years of pandemic-disrupted learning, according to national test scores released this morning.
Dismal releases from the National Assessment of Educational Progress (NAEP) — often referred to as the “nation’s report card” — have become a biannual tradition in recent years as academic progress first stalled, then eroded for both fourth and eighth graders. But today’s publication, tracking long-term academic trends for nine-year-olds from the 1970s to the present, includes the first federal assessment of how learning was affected by COVID-19.
The picture it offers is bleak. In a special data collection combining scores from early 2020, just before schools began to close, with additional results from the winter of 2022, the report shows average long-term math performance falling for the first time ever; in reading, scores saw the biggest drop in 30 years.
And in another familiar development, the declines were much larger for students at lower performance levels, widening already-huge learning disparities between the country’s high- and low-achievers.
The results somewhat mirror last fall’s release of scores for 13-year-olds, which also revealed unprecedented learning reversals on the long-term exam. But that data was only collected through the fall of 2019; the latest evidence shows further harm sustained by younger students in the following years.
Peggy Carr, commissioner of the National Center for Education Statistics, said on a call with reporters that the “sobering” findings illustrated the learning losses inflicted by prolonged school closures and student dislocation.
“It’s clear that COVID-19 shocked American education and stunned the academic growth of this age group of students,” Carr said. “We don’t make this statement lightly.”
To continue reading, click here.