 NAEP released 2022 national Long-Term Trend data on reading and mathematics this morning, revealing the academic impact of the COVID-19 school shutdowns. The data document a consistent pattern: Disadvantaged students suffered the greatest harm during the COVID-19 period.
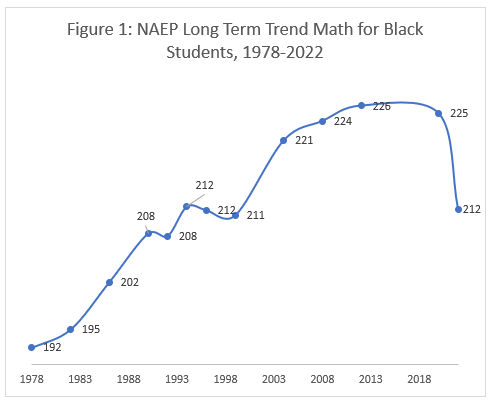
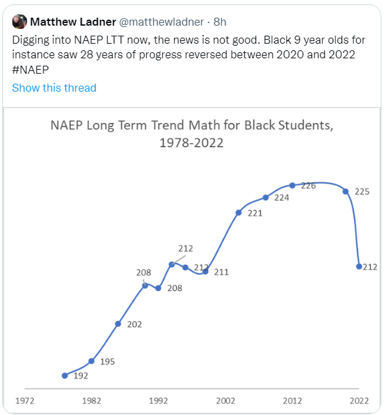
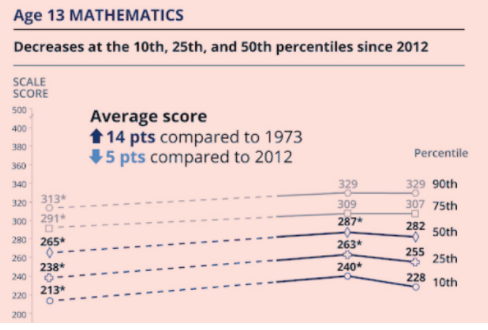
Figure 1 below, for instance, documents a reversal of 28 years of mathematics progress for Black students between 2020 and 2028.
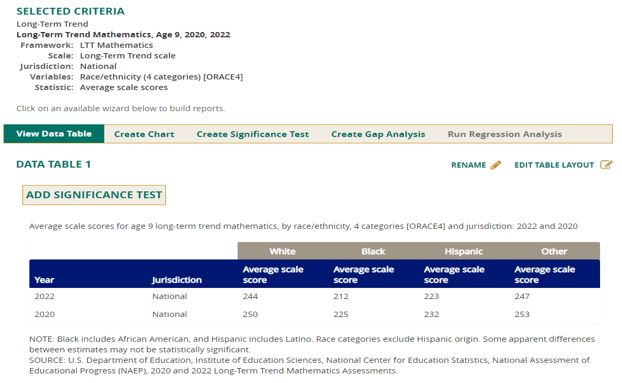
 Math achievement loss was approximately twice as large among Black and Hispanic students as white students:
 The NAEP reveals a similar pattern across groups: larger declines for low-income students than middle- and high-income students and larger drops for children with disabilities. The greater the reliance on the system a group had, the more those children suffered.
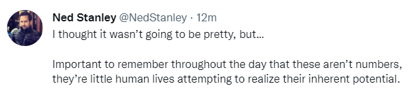
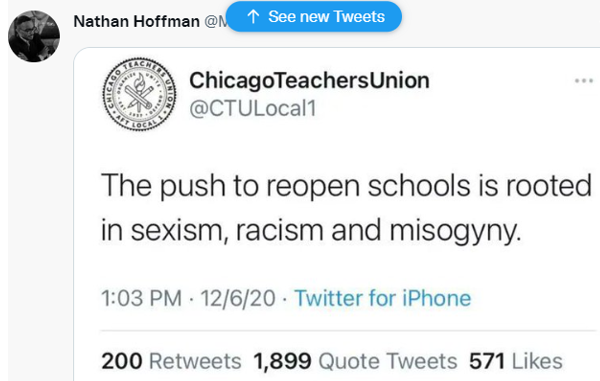
A few notable reactions to Figure 1 from social media:
 Meanwhile …
 And on a similar note:
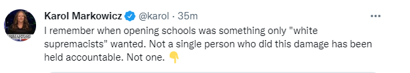 Hoffmann and Markowitz are entirely correct: We don’t live in a passive voice world. These declines didn’t simply happen to students; they suffered as a direct consequence of decisions made by adults. Academic progress was hard fought ground gained over decades but lost in two years of folly.
If you reckon this assessment overly harsh, note that dozens of countries around the world also examined the available medical data and kept their school systems open. When the crisis came, foreign authorities exhibited grace under pressure and made responsible decisions in long-term best interests of children.
They passed the test, we failed.
Staley’s point, however, is the most important of all: These numbers on screens and dots on charts represent “little human lives trying to live out their potential.” School systems have billions of dollars of unspent COVID-19 relief funds while their students soldier forward in life with substantial academic deficits.
Millions of students have stopped attending school and still more have dropped the habit of regular attendance. Failure to prioritize the interests of students has led to an equity fiasco, but late is always better than never in righting a course.
 The National Assessment of Educational Progress will soon release 2022 national long-term trend results followed by state level results later in the fall. This data will establish the scale of academic damage suffered during the COVID-19 pandemic.
I suspect the data also will reveal which states effectively rate their schools on a curve. Color me concerned that multiple states will have a relatively unchanged distribution of “highly performing” or A-rated schools despite having students that have suffered substantial academic setbacks.
 If this comes to pass, it should be the final insult of a misbegotten effort of governments to rate the performance of government schools. The task of rating schools should be left to private organizations.
The process of rating schools is inherently subjective and political. No Child Left Behind required states to adopt state academic standards, test public school students against those standards in grades 3-8 and once in high-school, and to rate schools based upon performance on those tests.
Requiring states to do something is hardly the same as requiring them to do something well. States promptly adopted everything from super-easy exams to very opaque school labels.
Florida, under former Gov. Jeb Bush, managed to adopt clear A-F school grades and to incentivize the academic progress of low-performing students in their funding formula. The initial grades had more D/F grades than A/B grades.
Based on Florida’s NAEP scores at the time, this was entirely justified. Crucially, Florida’s NAEP scores, which are external to state testing systems. improved. School grading probably deserves some credit for Florida’s NAEP improvement.
Florida has a great story to tell, but years later, the state appears to be a bit like Michael Jordan attempting to be a high school basketball coach: “Okay, men, what I want you do is take flight from the free-throw line and dunk the ball in a way that will humiliate the other team!”
I helped advocate for an A-F school grading system in my home state of Arizona. We have not been able to dunk from the free-throw line. On the plus side, the state’s previous system of vague descriptors was a complete waste of time.
Unfortunately, our state adopted a hopelessly complicated rating system that has not always made sense, and which has been repeatedly turned on and turned back off for a variety of reasons. School grades seem to be an obsession for people who run schools, but the public seems broadly unconcerned.
Private school rating platforms like Greatschools and Niche fortunately have their own systems to rate schools, collect community ratings of schools, and have internet traffic which dwarf those of the Arizona Department of Education. These platforms don’t take years off every time the state changes exams, they soldier on. Families have more confidence in non-profit ratings than government ratings and they value reviews.
 If Dianne Ravitch would like to create RavitchRatings.com and hand out trophies for all district schools, she is welcome to do so – First Amendment free speech and all. I’d prefer not to have state authorities handing out trophies for all.
The most robust form of accountability involves voting with your feet, and the private platforms have been taking the lead in informing these decisions for decades now. Government has been rating government; non-government rating the efforts of government in a pluralistic fashion is a superior practice for Political Science 101 reasons.
 The Thomas B. Fordham Institute’s Dale Chu provided an excellent summary of the reading controversies in the pages of the National Review in an article titled “Casualties of the Reading Wars.”
Chu walks readers through the research on reading methodology and outlines what might be described as a “poor reading industrial complex,” including but not limited to colleges of education, textbook publishers and many educators.
He opines, and I have never seen anything that would incline me to disagree, that proponents of “Whole Language” and the duplicitous rebrand of “Balanced Literacy” have proved themselves entirely unconcerned with research or evidence.
Citing progress on reading in Florida, and more recently Mississippi, Chu hopefully suggests: “But in the last few years, the momentum has been in the right direction. With a well-informed consensus on what constitutes effective reading instruction ascendant, an end to the reading wars could finally be in sight.”
In a post for Empower Mississippi, I outlined the evidence on the last decade of NAEP progress in Mississippi. This chart plots math proficiency rates for poor and non-poor students. Every red dot is a state from the 2009 NAEP, every blue dot a state from 2019.
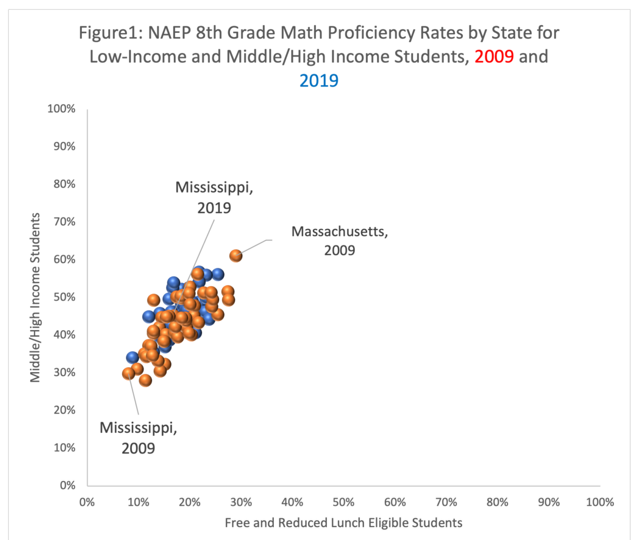
Ladies and gentlemen: That was indeed an impressive decade of improvement.
Just in case you think that regression to the mean is somehow inevitable, take a look at what happened in Alabama, Mississippi’s neighbor, during the same decade.
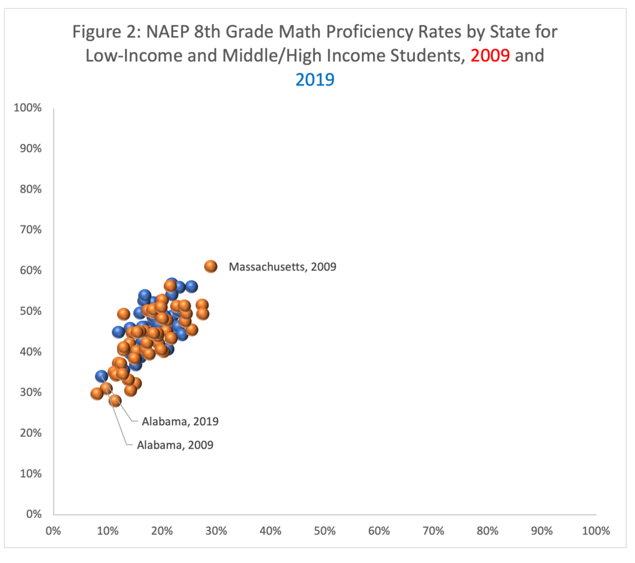
Is it time to unfurl the “Mission Accomplished” banner on our aircraft carrier? Possibly. Mississippi’s gains are indeed impressive. I live in Arizona, and I’d be pleased as punch to adopt scientific reading curriculum along these lines.
As former Florida Gov. Jeb Bush sagely notes: “Reform is never final and success is never finished.” The political coalition that spent decades keeping Mississippi’s success an isolated exception will actively seek to undo what has been done in the Magnolia State.
Chu accurately characterized the opponents of the “Science of Reading” and noted their immunity to research and evidence. The Science of Reading faction has been bringing evidence to a knife fight.
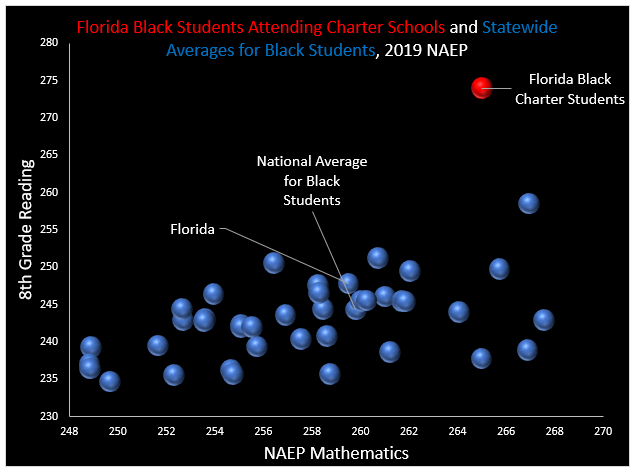
 I read the new American Federation for Children/Step Up for Students study on choice for Black students in Florida, and found a bit of inspiration in the following charts:
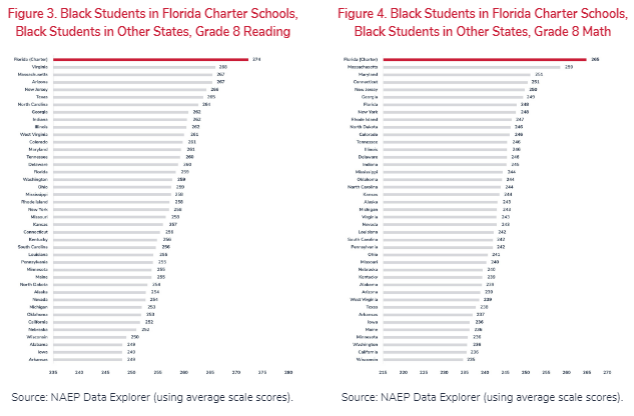 These charts compare the NAEP scores for Black students attending Florida charter schools to those of statewide averages for Black students. I asked myself, “Self, how would this look if we combined these two charts into one chart?”
In the chart below, 10 points approximately equals an average grade level worth of work on these exams, so Florida charter students were looking good in 2019.
 Next, I said to myself, “Self, what if we compared the scores of Florida Black charter school students to statewide averages for white students?”
Here’s what that looks like:
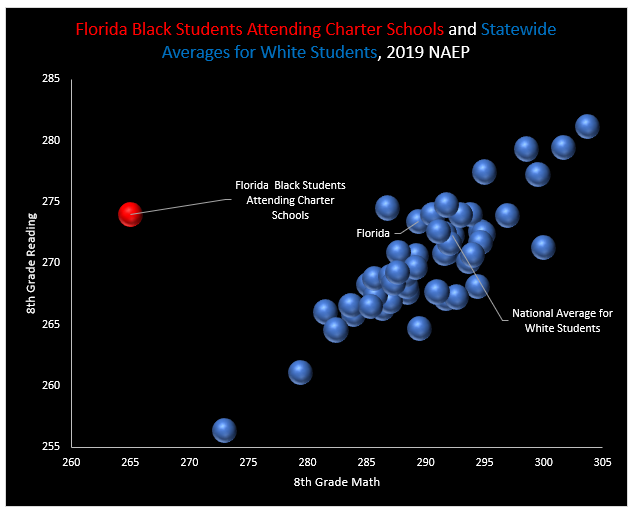 So, a couple of things to note: Florida’s Black charter students had a level of reading achievement similar to white students nationally as well as in Florida. Second, a large achievement gap remains in math.
So, put it all together and it looks like this:
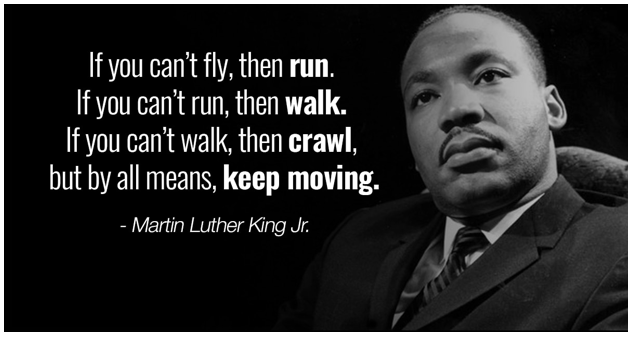
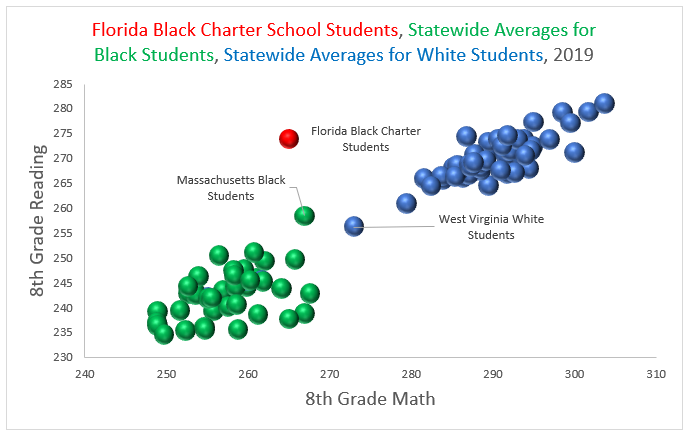 We clearly have a great many miles to go. Some will crawl, others will walk. Some, like Florida, relatively speaking, have been running.
As Dr. King said: Keep moving.
 Editor’s note: This article on this week's release of NAEP scores appeared Thursday on The 74.
Thirteen-year-olds saw unprecedented declines in both reading and math between 2012 and 2020, according to scores released this morning from the National Assessment of Educational Progress (NAEP).
Consistent with several years of previous data, the results point to a clear and widening cleavage between America’s highest- and lowest-performing students and raise urgent questions about how to reverse prolonged academic stagnation.
The scores offer more discouraging evidence from NAEP, often referred to as “the Nation’s Report Card.” Various iterations of the exam, each tracking different subjects and age groups over several years, have now shown flat or falling numbers.
The latest release comes from NAEP’s 2020 assessment of long-term trends, which was administered by the National Center for Education Statistics to nine- and 13-year-olds before COVID-19 first shuttered schools last spring. In a Wednesday media call, NCES Commissioner Peggy Carr told reporters that 13-year-olds had never before seen declines on the assessment, and the results were so startling that she had her staff double-check the results.
“I asked them to go back and check because I wanted to be sure,” Carr recalled. “I’ve been reporting these results for…decades, and I’ve never reported a decline like this.”
The eight-year gap between 2020’s exam and its predecessor, in 2012, is the longest interval that has ever passed between successive rounds of the long-term trend assessment; a round that was originally scheduled for 2016 was nixed for budgetary reasons. Given the length of time between exams and the general trend of increasing scores over multiple decades, observers could have expected to see at least some upward movement.
To continue reading, click here.
The science results on The Nation’s Report Card are out, and while the news isn’t all bad, it isn’t great either.
Scores for fourth- grade students have declined from the 2015 peak while scores for eighth- and 12th-grade science students have remained flat over the last decade.
The National Assessment of Education Progress (NAEP) is administered to a random sample of students across public, private and charter schools. NAEP tests are given in reading, math and science every few years. For the 2019 NAEP science exam, 88,200 students in grades 4, 8 and 12 took the test.
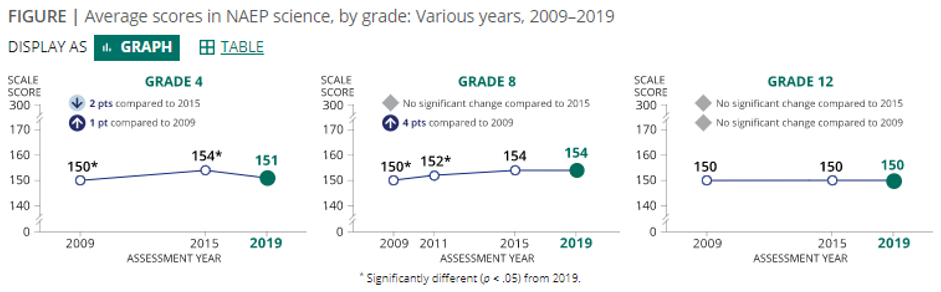 On the three science tests, there was no difference in results between 2019 and 2015 on physical science across all grades. However, fourth-grade students scored 4 points lower on life science and 2 points lower on earth and space sciences compared with 2015. There was no difference in results for life or earth science in the eighth- or 12th-grade results.
There is some encouraging news.
Demographic changes show America is drifting toward a majority-minority student population. Overall, white students declined from 60% of the student population taking the science exam in 2009 to 52% in 2019. Hispanic students grew from 17% to 25%, though Black students declined from 15% to 13%.
Impressively, Hispanic students saw a positive trend line throughout the decade in all three tested grade levels. Asian and Pacific Islander students scored the highest at 51% and 49% proficient or better, respectively.
The number of students eligible for free and reduced-price meals, who typically score significantly lower than non-eligible students, has increased from 40% of tested students in 2009 to 47% in 2019. However, 48% of test takers were eligible in 2015 when the test results were highest.
Now for the bad news.
Just 35% of students scored proficient or better in the science tests. Of them, only 14% of Black students and 20% of Hispanic students scored proficient or better. White students saw the largest declines between 2015 and 2019, with 47% of students scoring proficient or better, down from 50% in 2015.
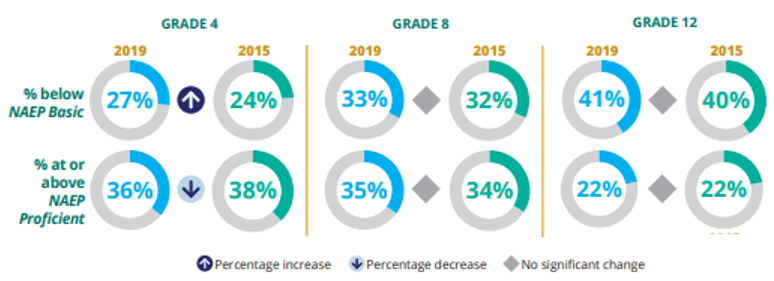 Despite no change in raw scores for students in eighth grade or 12th grade, the percentage of those students scoring proficient or better remains low, especially among high school seniors. The number of students who scored proficient or better declined from 36% in fourth grade to 22% in 12th grade.
So why are fewer than 1 in 4 seniors proficient in science?
A NAEP survey found that 50% of 12th-grade students reported rarely engaging in scientific activities in the classroom, compared with 30% in fourth grade and 42% in eighth grade.
Additionally, only 41% of 12th-graders have taken courses in biology, chemistry and physics since the eighth grade.
Both factors may be playing a large role in 12th-graders’ struggles to be proficient in science.
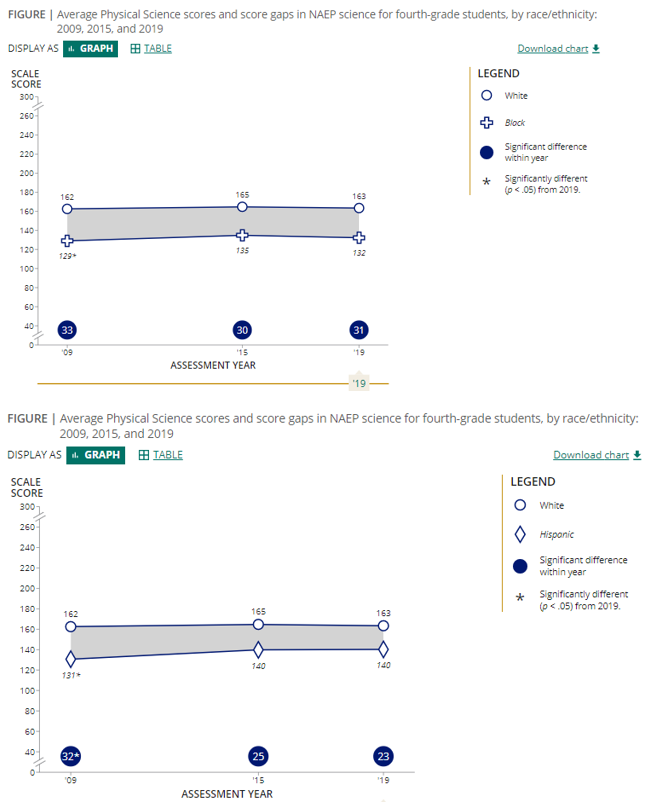
Large achievement gaps between white and Black students and white and Hispanic students still remain. The gap between white and Black students grew from 31 points in fourth grade to 34 points by eighth-grade. The gap between white and Hispanic students grow from 23 points in fourth grade to 25 points in 12th grade.
However, this gap is an improvement over the 2015 results because white students saw larger score declines than Hispanic students in the fourth and 12th grade science tests.
According to the report, the declines were driven by drops in scores among middle-performing students and the lowest-performing students. Students at the 50th percentile saw an average decline of 2 points. But the lowest-performing students saw the biggest declines. Students in the 25th percentile (meaning they scored as good as or better than 25% of students taking the test) declined 4 points, while students in the 10th percentile droped 5 points.
These low-performing fourth-grade students struggled across all three tests, with life science declining the most between 2015 and 2019. The lowest-perorming students also did worse compared to 2015 in eighth-grade physical science, eighth-grade life science, eighth-grade earth science, 12th grade physical science and 12th grade life science.
 The podcast “99% Invisible” featured a fascinating story of an impromptu shrine and the unexpected benefits it’s brought.
Dan Stevenson of Oakland, California, lived in a neighborhood beset with crime and drugs. An open space near his home was being used in 1999 as a site for illegal garbage dumping. Frustrated, Dan decided to clean up the space, purchase a statue of the Buddha, and place it on the site.
Strange things were afoot at the Circle K from that point forward. The trash dumping stopped. People began to leave offerings of various sorts at the statue. After being identified as the person who erected the statue, Dan started finding gifts left for him at his front door.
Daily prayer vigils began, and the space surrounding the statue was spruced up. Most interesting of all, recorded crime in the area dropped by 82%.
Erecting a shrine on public property might offend some sensibilities, but those in the area continue to appreciate it, and you can still visit it today.
University of Notre Dame law professors Margaret F. Brinig and Nicole Stelle Garnett may have found an echo of the Oakland Buddha in their statistical analysis between Catholic schools and neighborhood crime rates. Specifically, they examined data over time from Chicago and found that areas with closed Catholic schools experienced greater crime.
Interestingly, the analysis found no relationship between charter schools and social disorder.
A great deal more research lies ahead, but one of the aims of empowering families in education is to treat religious groups in a neutral fashion rather than actively discriminating against them.
American K-12 policy has addressed the question of religion through a series of follies. Public schools initially were used as an instrument of the Protestant majority to “assimilate” Catholic immigrants. The public schools were religious (Bible readings and all) but only in a fashion generically acceptable to Protestants. If you happened to be a Catholic, Jew, Buddhist, Muslim, Agnostic or Atheist, well too bad.
The Ku Klux Klan muscled through a law requiring public school attendance in Oregon in the 1920s. The Klan aimed to turn Oregon Catholics into “real Americans” (insert author gagging noise about here). The United States Supreme Court struck the law down. The productive course at that point (or any future point) would have been to embrace pluralism in education as is common in Europe.
As Winston Churchill once noted, Americans always can be relied upon to do the right thing but only after all other possibilities have been exhausted. Instead of “to each his own” in a fashion common in Europe, American public schools essentially banished religion from the curriculum in the decades following the Oregon episode.
The U.S. had precisely zero states in 2019 in which 50% or more of eighth-grade students could read at proficiency. I can live without these schools teaching religion, or their secular equivalents. If more kids could read proficiently, we would have hope for a future in which more adult Americans could think.
We may, however, have lost something very important in actively discriminating against religious schools, and it may stretch well beyond test scores. Government neutrality toward religious groups, neither favoring nor discriminating against them, creates a way forward in which the American people can shape the education space according to their needs and values.
We’ve exhausted all the other possibilities. It’s time to get this right.

Editor’s note: This guest editorial written by Florida Sen. Joe Gruters, who represents District 32 and serves as chairman of the Republican Party of Florida, first appeared in the Sarasota Herald Tribune.
In her Nov. 1 column, (Herald Tribune opinions editor) Barbara Peters Smith wrote that she welcomes a debate on school vouchers – as do I. But she describes a very different education landscape than the hard facts reveal. Two decades of data demonstrate that Florida’s Tax Credit Scholarship program has benefited the low-income students it is aimed at.
First, we need to put to rest the idea that private schools improve outcomes because they “weed out” students less likely to succeed. The truth is students who choose the FTC – 68% of whom are Black or Hispanic, with an average annual family income of about $25,755 – are among the lowest-performing students in the public schools they leave behind.
According to research by the Learning Systems Institute at Florida State University, new scholarship students scored roughly 5 percentile points lower in math and reading than scholarship-eligible public students in the year before they started on the scholarship. A 2013 report described the difference this way: “Scholarship participants have significantly poorer test performance in the year prior to starting the scholarship program than do non-participants … These differences are large in magnitude and are statistically significant.”
If that is “weeding out,” then private schools are doing a poor job of it – they’re taking the kids who have the biggest mountains to climb academically.
And yet, standardized test score analyses of FTC students consistently show that even though scholarship students were, on average, the lowest-performing students in their prior public schools, they’re now making the same annual learning gains as students of all income levels nationally. In other words, the average scholarship student has moved from falling further behind grade level each year to gaining a year’s worth of knowledge in a year’s worth of time.
That has led to long-term success. In its 2019 report, the Urban Institute found that FTC students were up to 43% more likely to enroll in four-year colleges than their public school peers, and up to 20% more likely to earn bachelor’s degrees. For those who used the scholarship four or more years, the outcomes were even stronger – up to 99% more likely to attend four-year colleges, and up to 45% more likely to earn bachelor’s degrees.
All these improved outcomes are coming at far less cost than the alternative. According to a 2019 analysis by Florida TaxWatch, the average amount for a Florida Tax Credit Scholarship was $6,447 in 2017-18, while the average per-pupil funding for Florida district schools was $10,856. That puts the value of the scholarship at 59% of the average, per-pupil cost in district schools.
It’s not just private school students who are benefiting from scholarships. A report this year from the National Bureau of Economic Research found as the FTC program expanded, students attending public schools most affected by the increased competition from private schools experienced higher test scores, reduced absenteeism and lower suspension rates.
Meanwhile, during this two-decades growth in tax credit scholarship enrollment – and education choice in general – Florida overall has made impressive strides in academic achievement. Florida ranks No. 3 in the nation in K-12 achievement, its highest position ever. The state also ranks No. 1, No. 1, No. 3, and No. 8 on the four core tests of the National Assessment of Educational Progress.
So much for choice dragging down Florida public schools.
The results are indisputable positives for Florida students, particularly low-income students. That’s why education choice supporters like me welcome a debate on scholarship programs: We have the facts on our side.

![]() The performance of American public schools was in decline before the pandemic struck; based on the latest results from the National Assessment of Educational Progress released Wednesday by the National Center for Education Statistics, things are likely to only get worse from here.
The performance of American public schools was in decline before the pandemic struck; based on the latest results from the National Assessment of Educational Progress released Wednesday by the National Center for Education Statistics, things are likely to only get worse from here.
The data show the average reading score for the nation’s 12th-graders declined between 2015 and 2019. Meanwhile, there was no statistically significant change in 12th-graders’ average mathematics score for the same time period.
Bottom line: considerably more money per pupil was spent to get the same not-so-great results.
The tests upon which the data is based were given in spring 2019, before the COVID-19 pandemic. The indications are now worse: Inflation-adjusted spending per pupil is up, childhood poverty is down, and scores are down rather than flat.
The earliest 12th-grade reading score in this series comes from 1992. The Class of 1992 benefited from a nationwide average of $105,560 in 2018 constant dollars spent on their K-12 education. The Class of 2017, the cohort from which we have the most recently available data, had a nationwide average of $158,431 in constant dollars spent on their education – approximately 50% more. The figure for the Class of 2019 will be even higher.
Which class, 1992 or 2017, demonstrated better reading ability? Let’s break down the results by parental education.
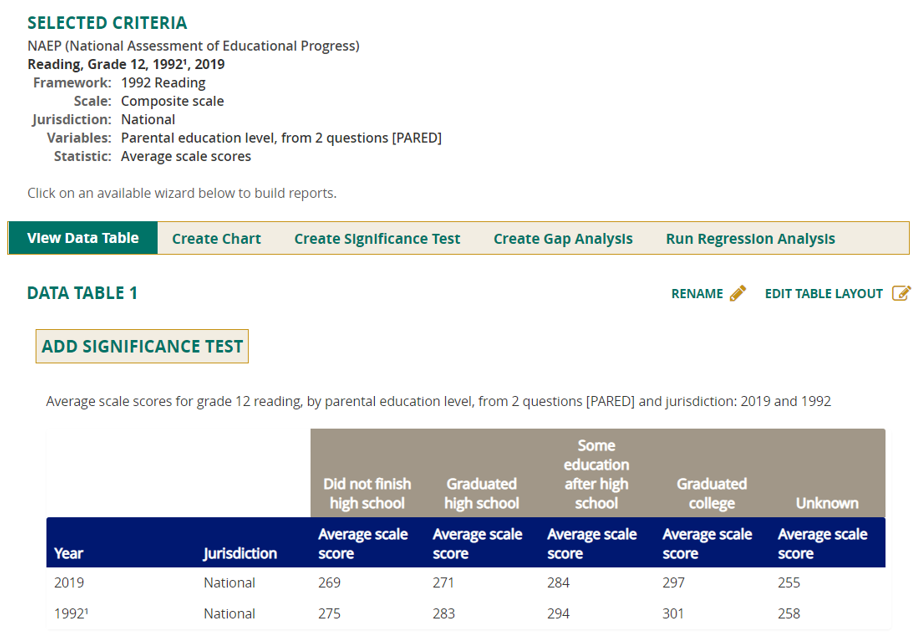
Regardless of the level of a parent’s education, reading scores were lower for the Class of 2019 than the Class of 1992. All of the above differences are statistically significant.
Now take a look at the chart below, provided by Michael J. Petrilli from the Thomas B. Fordham Institute, showing the decline in childhood poverty rates from the 1980s and 1990s.
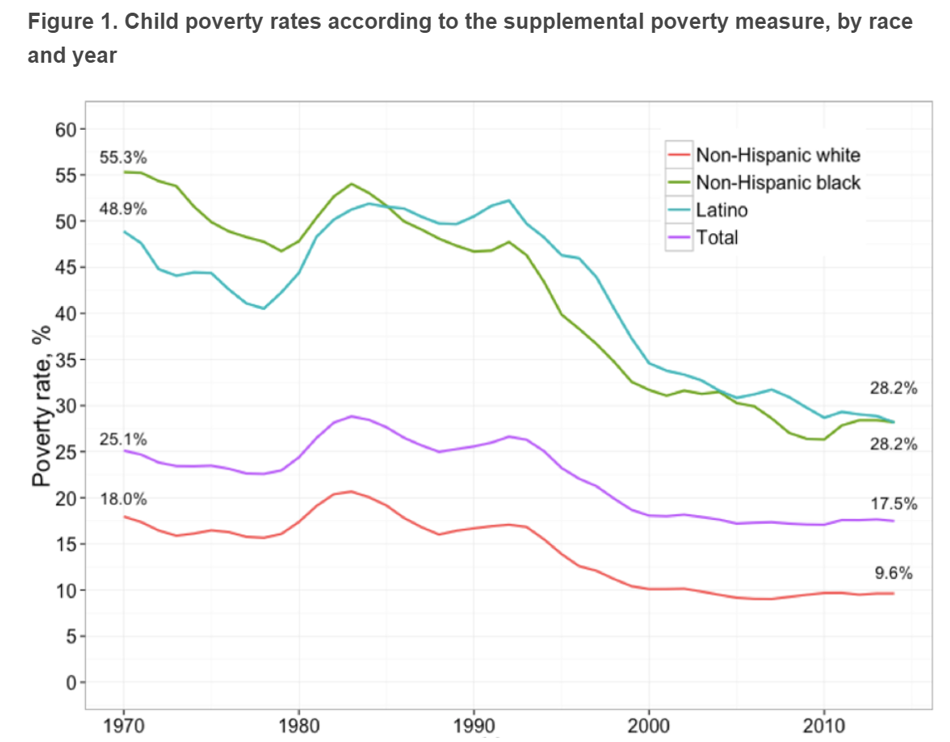
What the chart shows: higher spending, less poverty and lower national achievement.
Mind you, this was the trend before the current massive decline in instruction time due to the pandemic. I’ll dare to predict that if the NCES manages to conduct the scheduled 2021 NAEP, exams scores will decline across the board and achievement gaps will grow. K-3 kids who are in their literacy acquisition windows, for instance, in districts like Los Angeles Unified, Clark County Nevada and New York have been receiving less than half the amount of instruction time delivered during a normal school year.
And finally, special education trends were a disaster in many states before the pandemic, as detailed in this chart.
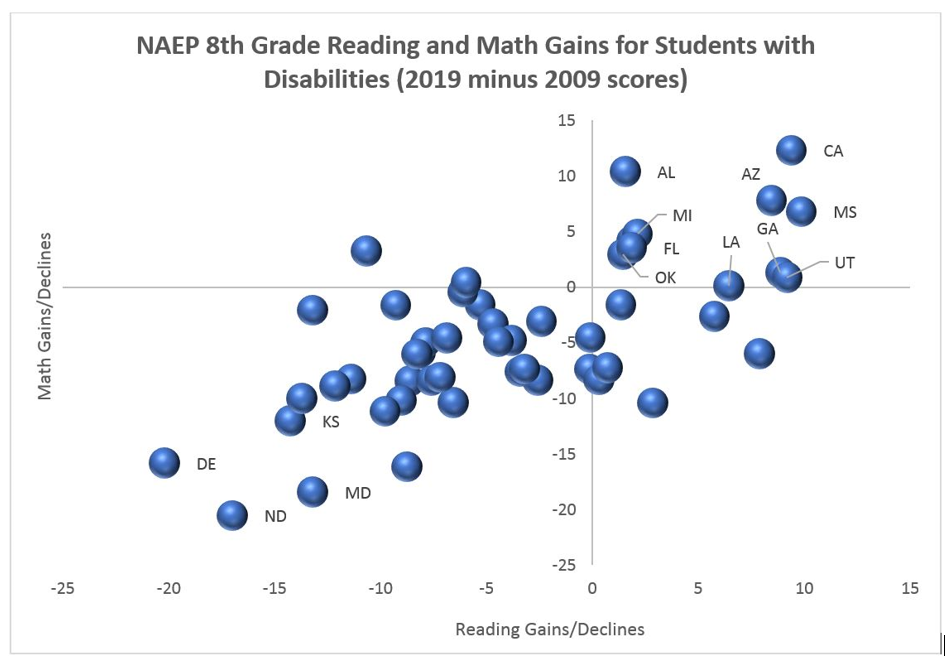
It’s difficult to imagine that this already dismal chart won’t look even worse with 2021 data, coming in the aftermath of generally reduced instruction time and special education being attempted using the Zoom platform. We are not out of the pandemic yet, but the academic damage seems likely to greatly outlive the virus.
These most recent data came among favorable conditions of declining poverty and increased spending. Very soon, we’ll be forced to face what happens when you reverse these favorable trends and we end up with a large percentage of students with huge academic deficits.
Buckle up.