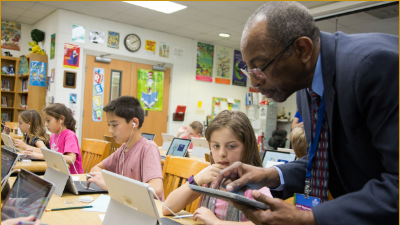
 Editor’s note: National Catholic Schools Week, celebrated nationwide since 1974, traditionally coincides with National School Choice Week. The theme – Catholic Schools: Learn. Serve. Succeed. – encompasses what Catholic school leaders consider the core products and values that can be found in Catholic schools across the country. James Herzog, associate director for education for the Florida Conference of Catholic Bishops, contributed today’s post in honor of this annual event.
There’s excitement in the air for Catholic schools this week.
 Across the nation, colorful signs and banners announcing the 46th annual National Catholic Schools Week are proudly displayed. Alumni are returning to their roots with gratitude to share with today’s Catholic schoolchildren their career journeys and life lessons. Activities including community service days, open houses and Masses are being held, all celebrating the academic, spiritual and financial benefits our society reaps from Catholic schools.
In Florida, we’re celebrating 244 Catholic schools that serve more than 85,000 students from Pre-K to 12th grade. Enrollment across the Archdiocese of Miami and the state’s seven dioceses – St. Augustine, St. Petersburg, Orlando, Pensacola/Tallahassee, Palm Beach and Venice – totals 85,416 for the 2019-20 academic year. Enrollment in Florida Catholic schools has held steady around 85,000 for the past decade, despite a plethora of other education choice options, and in the face of declining enrollment in other states.
An additional cause for celebration is Florida’s leading role in creating robust school choice scholarships for children from lower-income families and for those with unique abilities. A total of 25,300 Catholic school students rely on either a Florida Tax Credit Scholarship, a Family Empowerment Scholarship, a Gardiner Scholarship or a McKay Scholarship. Many of these children would not otherwise be able to attend a Catholic school.
But an overwhelming reason for our joy as we celebrate this very special week is the academic success of our students. Ninety-nine percent of students who attend Catholic high schools graduate; of that percent, 86 percent attend four-year colleges, according to the National Catholic Educational Association. The NCEA further reports that the student achievement gap is narrower in Catholic schools than public schools.
Even more remarkable, latest National Assessment of Education Progress scores show that Catholic school students outperformed their public school peers in the percent considered proficient in fourth-grade and eighth-grade reading and math. Thirty-five percent of Catholic school fourth-graders were proficient in reading compared with 26 percent of public school students, while 39 percent were proficient in math compared with 32 percent in public school. Forty-three percent of Catholic school eighth-graders were proficient in reading compared with 9 percent of public school students, while 31 percent were proficient in math compared with 23 percent in public school.
So the buzz about National Catholic Schools Week is more than just hype. It’s supported by demonstrable academic achievement as well as very tangible contributions to our communities and our nation.

A recent comparison of K-12 children around the U.S. brought bad news for education reformers—an amorphous group of policymakers and advocates who are akin to locksmiths searching for the right combination of resources and policy ideas to unlock student potential. The news was bad for students, too, but since the scores do not affect a student’s report card, the results mattered more to the aforementioned locksmiths today.
The results will matter for students tomorrow.
As readers of this blog will know, the Nation’s Report Card, also known as the National Assessment of Educational Progress (NAEP), is a set of math and reading tests given to a sample of fourth- and eighth-graders around the country every two years. The U.S. Department of Education also administers NAEP tests in other subjects and specific cities.
The more frequent math and reading results allow education locksmiths to gauge whether any number of inputs in the nation’s schools—from spending increases to new laws—are having their desired effects. With both more money and federal law firmly in place, observers were frustrated that national averages for 2019 reading and math scores fell from 2017 (with the 1-point improvement in fourth-grade math a small exception).
Rigorous research is required to appropriately link policies and school budgets to NAEP outcomes, but Florida’s aggressive upgrade to its K-12 education design in the early 2000s tracked closely with improved NAEP scores among minority students. The additional parent options in education, along with a focus on reading among third-graders and more attention to the use of Advanced Placement testing has been the subject of policy discussion around the country since.
This year, reformers pointed to similar reading-related policies in Mississippi to explain the state’s improvement in fourth-grade scores, while calling for “urgent action” elsewhere. The Council of Chief State School Officers even said the “urgency of improving outcomes for all students” was enough to plan … a meeting. This “urgent action” is why the results will matter for students tomorrow: That is when the changes will affect the classroom. Parents can only hope it is not too late by then.
Nationally, average scores among fourth- and eighth-grade students increased in math by 27 points and 20 points, respectively, between 1990 and 2009. Yet since 2009, and a decade is almost the length of a child’s K-12 career, the improvement stalled. Reading scores have improved by just three points in both grades since 1992.
It is these scores and other comparisons that have not changed that should bother reformers and policymakers alike in 2019. Last summer, Harvard University’s Paul Peterson wrote in Education Next that the test score gap on NAEP and international tests between students from low-income families and their more affluent peers has not changed since the 1960s. Peterson wrote later that the “performances on math, reading, and science tests of the most advantaged and the most disadvantaged students differ by approximately four years’ worth of learning, a disparity that has remained essentially unchanged for nearly half a century.”
Such findings temper enthusiasm for any year-to-year increases. So, too, do the results from NAEP’s other test, the Long-Term Trend Assessment (LTT). Average scores for 17-year-olds in math and reading have not changed since the 1970s (the LTT was last given in 2012 and is scheduled to resume in 2020). Students appear to lose any gains made in elementary and middle school by graduation.
Over time, these results have been depressingly more of the same, which should incentivize education reformers and policymakers not to do the same things. Such as: In the last two years, many state policymakers were either absent or complicit in teacher union attempts to keep students in assigned district schools by curbing charter school growth in Los Angeles and Chicago and blocking new private learning options in Kentucky and West Virginia.
These options are the most significant departures from the routine of school-by-zip-code because parents can help a struggling child immediately by moving them to a new setting with a charter school, private school scholarship or education savings account. Students will not have to wait for the urgent meetings to finish, hoping to find success this time.
Now that would be different.
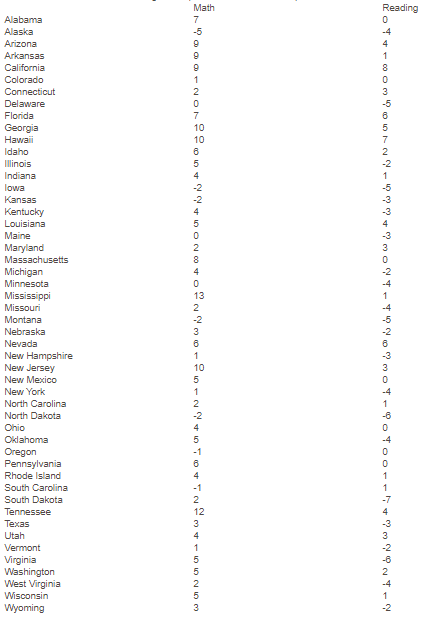
 The aughts were a time of K-12 academic improvement. For some states, including Florida, that improvement started earlier, but included the era illustrated in this chart.
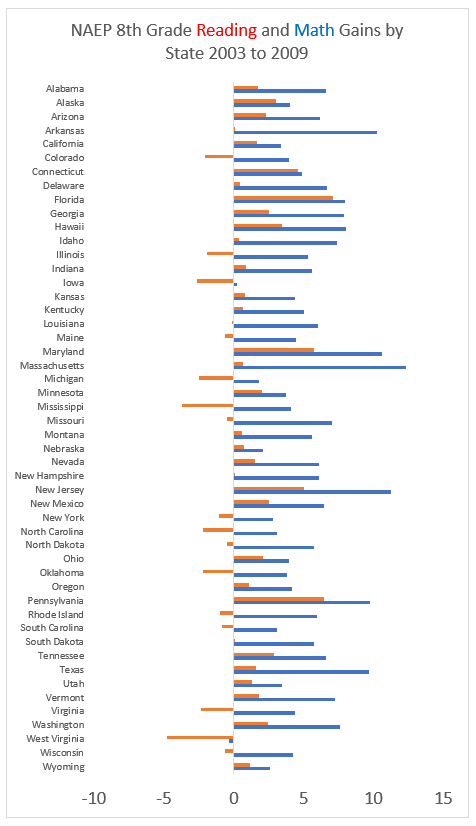
All states began participating in NAEP exams in 2003. Most states experienced a pronounced improvement in eighth-grade reading and eighth-grade math from 2003 to 2009. On these tests, 10 points equals approximately one grade level’s worth of average progress.
As you can see, there are far more bars going in a positive direction in the first chart and relatively few going in a negative direction between 2003 and 2009. Now let’s examine the same sort of chart between 2009 and 2019.
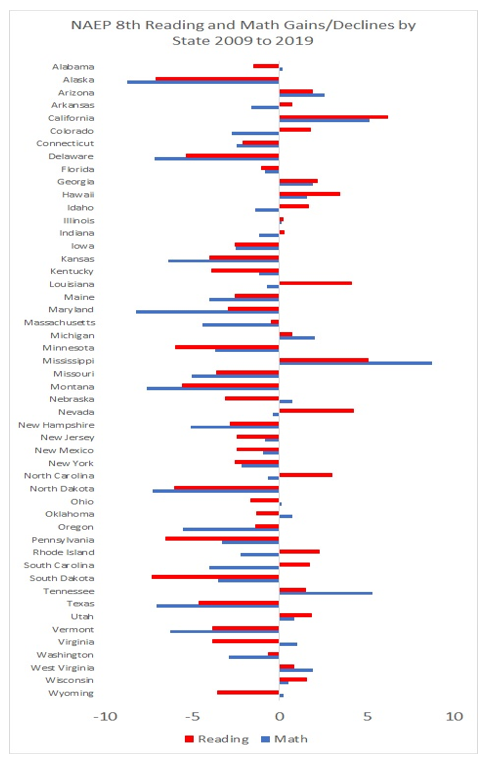
Things went badly after 2009 in most states. Some broad theories readily come to mind but are weaker than they might seem.
Most states adopted the Common Core standards after 2009, for instance. Prominent analysts of the center right and left have studied the impact of Common Core on academic achievement and have reached a common conclusion: not much positive or negative impact. Look at Texas on both charts; positive experience in 2003 to 2009, deeply negative experience from 2009 to 2019. Texas never adopted Common Core.
Obviously, lots of states that did adopt also had bad decades, but Mississippi had the biggest 2009 to 2019 gains. Judged against lofty promises of improvement, the Common Core project clearly fell flat at a high cost in terms of political and financial capital. That is very different than saying they worsened outcomes, but it’s still very bad.
It was the economy! My friend Mike Petrilli has been exploring the theory that the Great Recession is a driver of decline in NAEP performance. Texas, again, is a fly in this ointment.
The Texas economy got off light in the Great Recession and boomed economically for much of the 2009 to 2019 period, but Texas scores worsened statewide. The so-called “Sand States” – Arizona, California, Florida and Nevada – were the hardest hit in the housing downturn, but they all had a much better decade driving academic improvement than Texas.
Per-pupil spending has been increasing since fourth-graders of 2019 took the NAEP, and for most of the time eighth-graders have been in school. We should hope that Mike is wrong about this given that the country is overdue for a recession by historical standards.
Sandy Kress makes the case that the blame lies in the Obama administration’s decision to let the pressure off test-based accountability. The trends certainly show something went south after 2009, and Sandy may be right. It’s worth considering whether something had to give with the 100 percent-ish proficiency on a deadline NCLB requirement.
Before President Obama took office, I had feared states might simply drop their passing thresholds if the federal government stuck to its guns. Moreover, the Common Core project coupled with teacher evaluation can be seen as a doubling down on high-stakes testing strategies, one that radicalized opponents countered in a variety of (largely predictable) ways.
So, what to make of all of this?
Providing academic transparency to parents, taxpayers and policymakers remains vital, but it’s clear the public is not on board for heavy-handed, top-down testing mandates. We live in a democracy, and the demos is not enamored with the idea of closing schools based on test scores and firing teachers based on test scores, and are sick of the amount of test prep going on in school these days. If you doubt any of that, feel free to focus-group it, or alternatively go outside and talk to normal people.
In many states, much of the low-hanging academic improvement fruit of the NCLB era has been reversed post 2009. Sun Tzu wrote that “a victorious general wins and then seeks battle whereas a defeated army seeks battle and then seeks victory.” It’s clear which of these two profiles education reformers more closely resemble today.
A good first step to recovery would be to focus on policies that have the prospect of developing supportive constituencies rather than annoying the public. Those who adhere to the status quo have the upper hand in most states even without antagonizing the public.
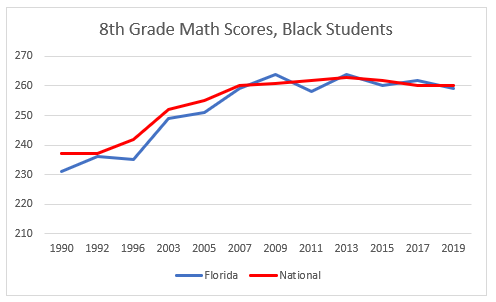
![]() Year-to-year student achievement will always fluctuate, but how does Florida stand in the larger picture? While results from the 2019 National Assessment of Educational Progress should concern everyone involved with K-12 education, Florida’s long-term trend is holding despite the recent score stagnation. And as we reported last week, Florida maintained high rankings when adjusting for demographics.
Year-to-year student achievement will always fluctuate, but how does Florida stand in the larger picture? While results from the 2019 National Assessment of Educational Progress should concern everyone involved with K-12 education, Florida’s long-term trend is holding despite the recent score stagnation. And as we reported last week, Florida maintained high rankings when adjusting for demographics.
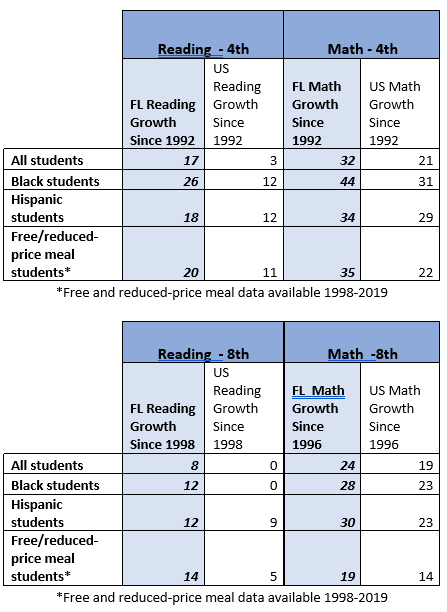 Among eighth-grade math students, Florida has improved 24 points compared to the national average of 19. Black students are up 28 points compared to 23 points nationally, and Hispanic students are up 30 points compared to 22 points nationally.
Eighth-grade reading, typically a sore spot for Florida given the tremendous success in the early years, is up 8 points compared to 21 years ago. But the situation is much worse for the national average, where there has been no improvement on eighth-grade reading scores since 1998.
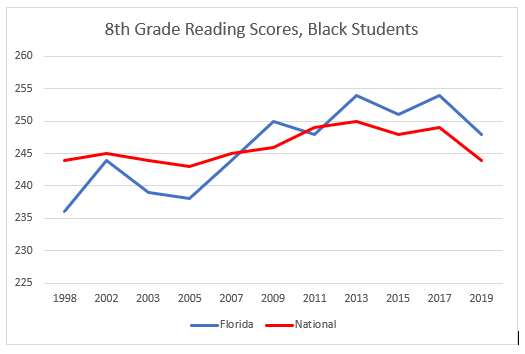
Black eighth-graders in Florida, despite being down from last year, still have improved by 8 points since 1998. The average black student nationally has seen no improvement since 1998.
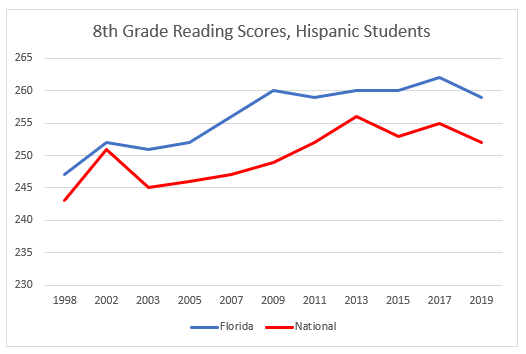
Hispanic students fare better on English reading, up 12 points in Florida and 9 points nationally since 1998.

![]() In a statement released Wednesday by the U.S. Department of Education, Secretary of Education Betsy DeVos called 2019 NAEP results “devastating,” opining that the country is in a “student achievement crisis” that has continued to worsen over the past decade.
In a statement released Wednesday by the U.S. Department of Education, Secretary of Education Betsy DeVos called 2019 NAEP results “devastating,” opining that the country is in a “student achievement crisis” that has continued to worsen over the past decade.
While the results aren’t great, they’re not quite that bad. One bright spot is that Florida maintains high rankings when adjusting for demographics.
Florida ranks first in fourth-grade reading, first in fourth-grade math, third in eighth-grade reading and eighth in eighth-grade math, according to the Urban Institute’s adjustment of rankings for race, income and English language learner status – and maintains those rankings despite drops in scores for students in the Sunshine State. Nevertheless, those declines are worth exploring.
Florida’s fourth-grade reading dropped 3 points, with Hispanic students seeing a 4-point decline and low-income students seeing a 3-point decline. Eighth-grade reading dropped 4 points, with black and Hispanic students dropping 6 and 3 points, respectively. Florida’s overall eighth-grade reading scores tie the national average, consistent with last year’s scores.
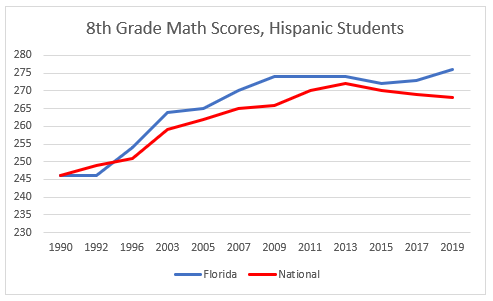
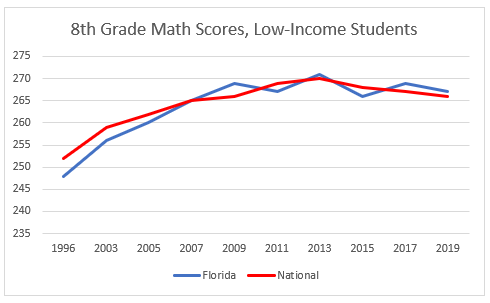
Florida maintained its scores in fourth-grade math and eighth-grade math, however black students declined 3 points while eighth-grade Hispanic students improved by 3 points. Florida’s eighth-grade black students scored at the national average relative to their peers, while Hispanic students maintained a healthy 8-point lead. Florida’s eighth-grade Hispanic math students are the state’s lone bright spot within the 2019 NAEP results.
As the charts show, Florida’s results in 2019 are still far beyond where Florida students started back in 1998, despite the decline.
 Editor’s note: redefinED executive editor Matt Ladner, responding to a request from EducationNext, made a prediction about 2019 NAEP scores prior to their release Wednesday. Ladner’s subsequent commentary for EducationNext, following the release, is published below. You can read reactions from other national education policy experts here.
![]() Shakespeare’s Henry V includes a scene in which the young King of England reads off a list of casualties his army inflicted upon the French after the Battle of Agincourt, including a long list of French nobles.
Shakespeare’s Henry V includes a scene in which the young King of England reads off a list of casualties his army inflicted upon the French after the Battle of Agincourt, including a long list of French nobles.
“Here was a royal fellowship of death…” Henry notes grimly. This scene comes to mind when reviewing the 2019 NAEP, and states are generally not, alas, playing the role of Henry.
More on that in a bit.
I made three predictions before the release of the 2019 NAEP: that nationally scores would continue to stagnate, that the impact of the 2018 educator strikes would appear in the data, and that a statewide black student cohort would exceed a statewide average score for white students on the same test/year.
It looks like my caffeine-fueled oracle got two out of three: Nationally, scores continued to stagnate, and a black subgroup finally surpassed a white subgroup for the first time. Congratulations to black students in Massachusetts, who not only exceeded the statewide average score for the lowest scoring statewide average for white students on eighth-grade reading, but also moved into a tie with Arizona for the highest average score for black students on eighth-grade math.
The evidence on strikes at first glance appears inconclusive. Some jurisdictions like West Virginia and Los Angeles had very rough results. Other places without strikes also had rough results, and some of the jurisdictions with strikes like Arizona and Oklahoma had mixed results.
Special education results, on the other hand, are an Agincourt-level disaster.
NAEP eighth-grade reading and math gains for students with disabilities (2019 minus 2009 scores)
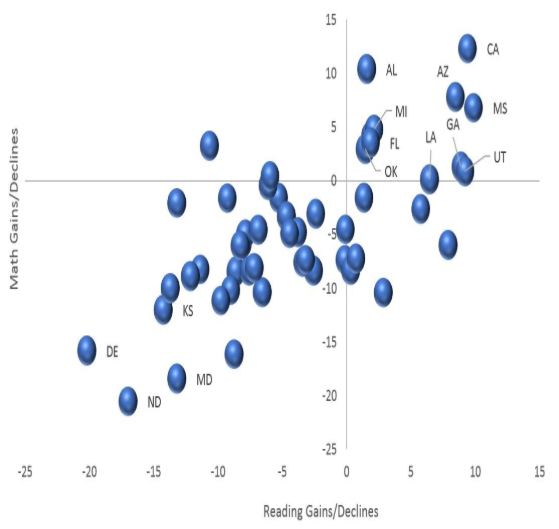
NAEP has been given to all states since 2003. After 16 years, this is what each state has to show for it in terms of eighth-grade math and reading gains. On these tests students, make approximately 10 points worth of progress on average per year between fourth and eighth grades.
Mind you that the United States spends high but has older students who score low on international exams, so most states had enormous room for improvement in 2003, especially among children of color:
NAEP eighth-grade math and reading gains (2019 minus 2003 scores)
No state managed to notch a double-digit gain in both math and reading during these 16 years. Plenty of states saw declines in scores.
Once more unto the breach, dear friends …
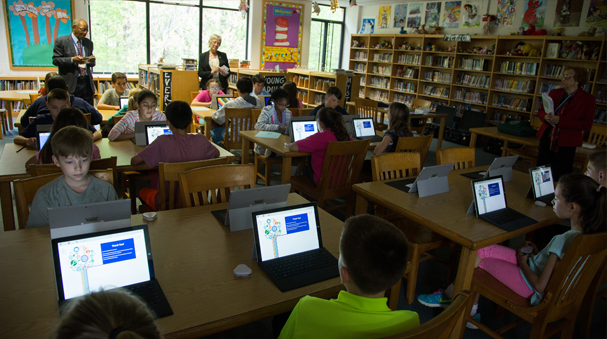
Between January and March, students who participated in NAEP were assessed in mathematics, reading, and science. Most students took the assessment on tablets, while a small subset took paper-and-pencil versions to help NAEP evaluate any differences in student performance between the two methods of test administration.
![]()
Last week Education Next published predictions from leading education scholars about how the 2019 National Assessment of Education Progress (NAEP) test results would shake out. The boldest prediction came from Morgan Polikoff, an associate professor at the University of Southern California.
Polikoff anticipated that President Donald Trump’s “racism” and “attacks on Latinix people in particular” would cause an increase in the achievement gap between whites and Hispanics, with the largest gaps growing in border states and states controlled by the Republican Party.
You can read his full prediction here.
Polikoff is correct that America is more politically polarized today than in many decades, so it’s clearly worth exploring the prediction. But the results suggest Polikoff appears to either grant Trump far more power over student achievement than is realistic, or assumes students are more fragile than they really are. Perhaps both.
Either way, his hypothesis is not only incorrect, but we find larger achievement gaps in Democratic-controlled states than Republican ones. In fact, Democratic-controlled states have less achievement equity than Republican states.
First, the border states:
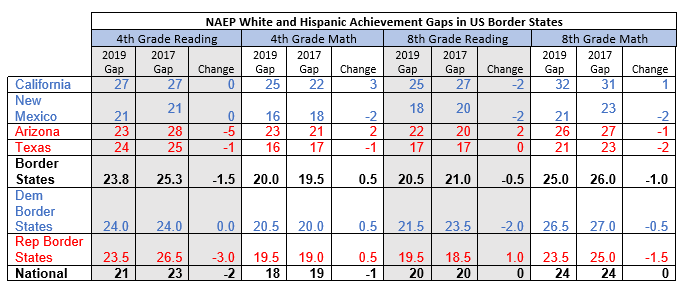
Border states’ achievement gaps and changes in achievement gaps are similar to the rest of the U.S. Border states controlled by Democrats perform slightly worse than Republican ones, though this difference is mainly driven by California.
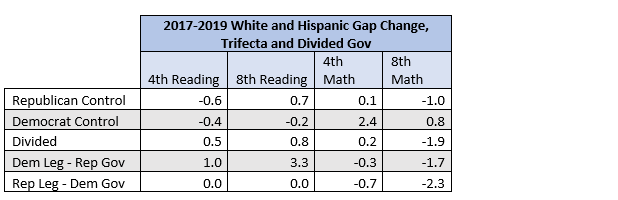
States with a Republican “trifecta” -- that is, one-party control of both houses of the legislature and the governor’s office -- see smaller racial achievement gaps in fourth-grade reading, eighth-grade reading, fourth-grade math and eighth-grade math than Democratic trifectas. Democratic-controlled states, on average, performed worse compared to states with divided governments. States with Republican legislatures and Democratic governors, on average, performed better than states with Democratic legislatures and Republican governors.

There were 13 states with Democratic trifectas and 21 states with Republican trifectas. Twelve states had divided governments, though Nebraska has a unicameral legislature instead of a traditional bicameral (house and senate). The National Conference of State Legislature’s database was used to determine party control.
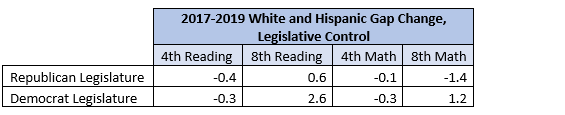
The results are the same when examining control of the state legislature only. There were 29 states with full Republican control of the legislature and 16 states with full Democratic control. States with insufficient Hispanic students to provide a score were dropped from the comparison.
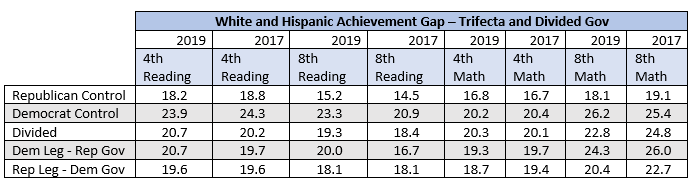
The achievement gap between 2017 and 2019 was also more likely to decline in Republican trifectas than Democratic trifectas. Republican trifectas did see an increase in the eighth-grade reading gap, but Democratic trifectas saw a much larger widening of the fourth-grade math gap. Divided governments performed better than Democratic trifectas, except on eighth-grade reading. States with Republican legislatures, but Democratic governors, performed better than those with Democratic legislatures and Republican governors.
Negative numbers in the chart below mean the gap between white and Hispanic students closed. A positive number represents an increase in the achievement gap.
When examining only one-party control of the legislature, Democratic-controlled states perform worse across the board on the change in the achievement gap.
Finally, I checked to see if the Democratic achievement gaps might simply be due to higher overall performance. Democratic-controlled states are, on average, much better at teaching white students than Republican-controlled states but are worse at teaching Hispanics. This remains true for trifectas and one-party legislative control.
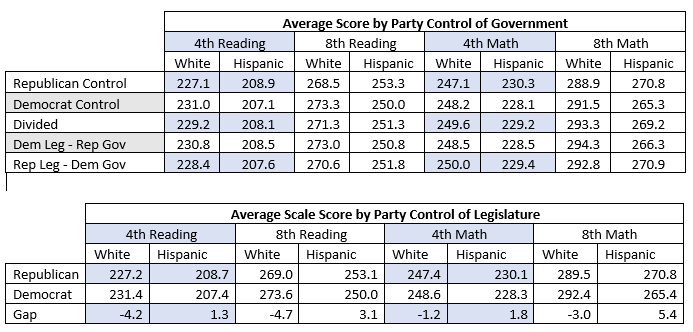
In other words, Republican-controlled states are more likely to provide equitable education outcomes than Democratic states. If racism is the cause of achievement gaps, as Polikoff hypothesized, it certainly isn’t more pronounced in Republican states. States under Democratic control, however, might want to look inward.
 Editor’s note: Federal officials will release results from the 2019 National Assessment of Educational Progress, or NAEP, on Oct. 30. The congressionally mandated project administered by the National Center for Education Statistics, also known as “the nation’s report card,” provides group-level data on student achievement in reading and mathematics for grades 4 and 8. EducationNext asked four national education policy experts, including redefinED executive editor Matt Ladner, to predict this year’s findings. Ladner’s take is offered here.
You can read predictions from Matthew M. Chingos, Sandy Kress, Susanna Loeb, Paul E. Peterson, Michael J. Petrilli and Morgan Polikoff in the full report, available here.
Greeks of antiquity consulted the oracle of Apollo for predictions about the future. The rituals involved the use of drugs and inhalation of mind-altering vapors among other things, like sacrificing a goat. Apparently in combination, these rituals inspired the oracle with the ability to make cryptic predictions with multiple possible interpretations – a handy skill when you don’t actually know much about the future.
The request to make predictions about the new NAEP data puts me in a dilemma similar to that of the oracle. NAEP results act like an oblong ball that bounces in unpredictable ways, and moreover, we have limited understanding of the policy factors influencing trends and even less understanding of the non-policy factors. Some of the things we think we know are probably mistaken, and we don’t agree on what we think is known.
Accordingly, I’ve decided to employ a modernized Delphic method. I’ll spare the goat, and I’m not much for inhaling vapors, but having consumed massive amounts of my drug of choice, caffeine, I will dare a few predictions.
Prediction 1: America continues to play in its academic food.
The 2009 to 2017 period proved broadly disappointing nationally. The country saw no progress in fourth-grade math or reading during this period, nor in eighth-grade math. The national average for eighth-grade reading improved by 3 points. In short, meh to sub-meh improvement.
Few states escaped the stagnation gravity well. Arizona and Mississippi students, though, did demonstrate statistically significant gains on all six NAEP exams given after 2009 (fourth-grade and eighth-grade math and reading 2009 to 2017, and fourth-grade and eighth-grade science 2009 to 2015).
Staring deeply into the prophetic clouds in my coffee, I’ll predict that the average state fails to reach a net +2 for the full 2009 to 2019 period. I hope to be wrong on this prediction.
Prediction 2: The 2018 strikes will leave a mark in the data.
Labor actions closed schools in 2018 in West Virginia, Oklahoma, Arizona, Los Angeles, Colorado and North Carolina. These strikes varied in length and breadth. Of course, we’ll never know what the 2019 NAEP scores would have been if these strikes had not occurred. Apollo’s caffeinated whispers, however, lead me to believe that kids learn more when they are in school than when they aren’t, and that many schools adhere to “make-up time” rules in a half-hearted fashion if at all. It won’t be possible to establish causality, and we would expect to find a mixed bag of results in these jurisdictions regardless, but a curious pattern of bubbles in my London Fog leads me to believe that a fairly consistent (negative) pattern may emerge. Again, I hope I am wrong on this one.
Prediction 3: Achievement gap milestone breached in the 2019 NAEP.
No state’s black student population has ever matched or exceeded the score for any state’s white population on any NAEP exam. The racial achievement gap has been deep enough that even the highest statewide average for black students has never matched that of the lowest performing statewide average for Anglo students. But it’s been getting close in recent years.
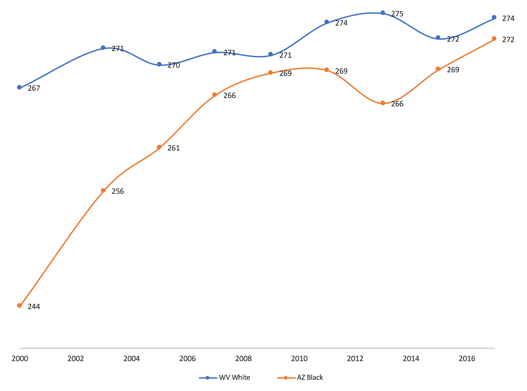
NAEP eighth-grade math scores for Arizona black students and West Virginia white students, 2000-17
Arizona has had the highest performing African American student population, and their NAEP scores have improved strongly over time. The 2-point gaps seen in both 2009 and 2017 were very close. Scores for both West Virginia Anglos and Arizona black students may take a hit in 2019 (both states experienced strike-related school closures), but this may not prevent the lines from crossing.
Apollo sends word: 2019 will be the year where the highest performing black statewide group will bank a statewide average NAEP score higher than the lowest performing Anglo statewide average. Which is not at all to say that this is high enough, but it is an important milestone we have yet to cross. I hope I am right on this one!

Emmy award-winner Uzo Aduba stars as Virginia Walden Ford, a champion for the education choice movement who was instrumental in creation of the D.C. Opportunity Scholarship Program, in the movie Miss Virginia.
The most rewarding aspect of working in the family empowerment movement, hands down, is the people you meet. One of my all-time favorites is Virginia Walden Ford.

Virginia Walden Ford
Walden Ford grew up in Little Rock, Ark., during the battle for school integration. Decades later, she led the fight for the Opportunity Scholarship Program in Washington, D.C. Now, her story has been made into a movie released by the Moving Picture Institute.
Commenting on the film Miss Virginia, EdChoice founder and CEO Robert Enlow noted that “In today’s cynical political world, Virginia’s story is a reminder that one person – one motivated mom who knew the system was rigged against her – can change the course of history.”
Rigged indeed!
The District of Columbia public education system that Walden Ford encountered as a parent in the 1990s was entirely rigged against the poor. The well-to-do in Washington, D.C., either paid for private school tuition out of their own pockets or were well-ensconced on islands of privilege in a very high-spending but tragically dysfunctional district. The striving professional class tended to bail out either to Maryland or Virginia.
Washington, D.C., NAEP scores of that era indicate that any learning taking place in public schools was accidental. If you think that statement harsh, consider the fact that a dismal 7 percent of black D.C. fourth-graders scored proficient in reading. If someone had set out to purposely create a school system to advantage the advantaged and keep the poor down, spending an absurd amount of money in the process, the protype was cast in the form of D.C.-area schools circa the end of the 20th century.
Walden Ford led the grassroots fight to provide expanded opportunities for D.C.’s low-income children, ultimately triumphing with passage of the D.C. Opportunity Scholarship Program in 2003. Participants in that program, by the way, demonstrated a 20 percent higher graduation rate despite only receiving a fraction of the per-pupil spending in DCPS.
Imagine what those students could do if they received their fair share of funding and the chance to spend it on tutoring and enrichment programs in addition to – or instead of – private school tuition.
Standing on the shoulders of a giant, the next generation of opportunity warriors should follow Walden Ford’s example and challenge a continually distracted Congress to pay attention to what still is a crisis for poor children in Washington, D.C. A modernized D.C. Opportunity Scholarship Program could provide still greater chances for D.C. families to improve their prospects.
You will never meet a more genuine, passionate and down-to-earth advocate than Walden Ford. I’m eager to see the extent to which the filmmakers have done justice to her story.
Charter schools and home schooling are experiencing major growth. Meanwhile, there were no significant differences between students in charter schools and traditional public schools in average reading and mathematics scores on national tests in 2017.
Those are two of the key findings in the U.S. Department of Education’s (USDOE) latest report, “School Choice in the United States,” which updates the national changing landscape for school choice with changes in enrollment data, academic performance updates, and parental satisfaction surveys. Nationally, charter public schools and district schools increased enrollment while private schools declined.
Overall, there were around 57.8 million K-12 students in the United States, up from 53.8 million in 1999. Based on figures from the USDOE, the market share of district schools fell from 87 percent of all students in 1999 to 81.8 percent of students by 2016.
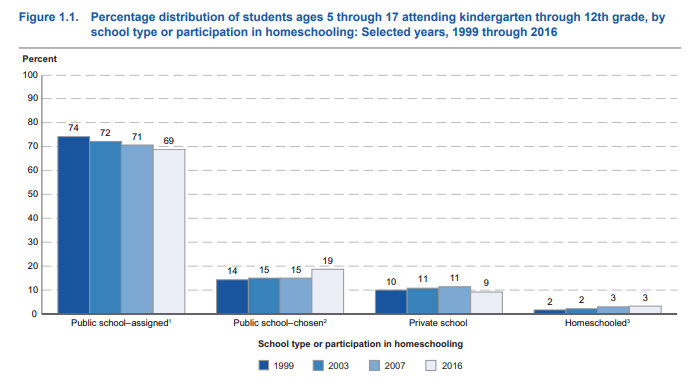
From 1999 to 2016 the share of students attending their assigned neighborhood public schools dropped from 74 percent to 69 percent. Public school choice option, including charter schools, magnet schools and open enrollment programs, grew from 14 percent of the student body in 1999 to 19 percent. Charter schools alone grew a staggering 571 percent from 2000 to 2016, enrolling over 3 million students by 2016.
Private school options fell from 10 percent to 9 percent, while home education grew from 2 percent to 3 percent by 2016.
Unlike most of the nation, however, Florida has seen private school enrollment bounce back. In 2000, 348,000 students enrolled in nonpublic schools, comprising 12.5 percent of the total PK-12 student body. Thanks to the help of several private school programs, including the Florida Tax Credit Scholarship, private schools in the Sunshine State continue to grow. In 2018-19, the latest data available, 380,000 students enrolled in nonpublic schools, though the market share has declined to 11.8 percent of Florida’s total PK-12 student population.
Catholic schools remain the top choice among private school parents, enrolling more than 2 million students in 2016, more than double any other denomination.
District schools enrolled 94 percent of all public school students, with charters enrolling the other 6 percent. District schools were more likely to enroll white students, and less likely to enroll black or Hispanic students, than charters. According to the USDOE, 57 percent of public schools were 50 percent or more white, while just 33 percent of charters were. Charters were more likely to be 50 percent or higher black or Hispanic, however.
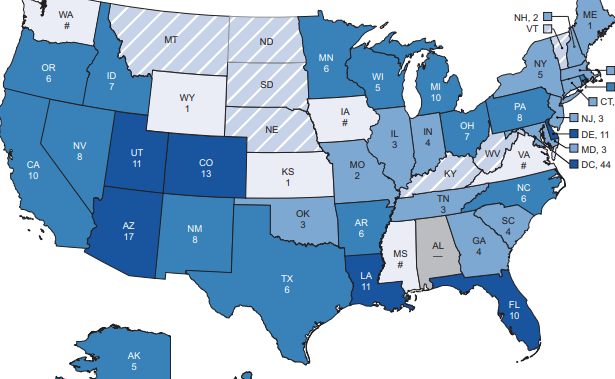
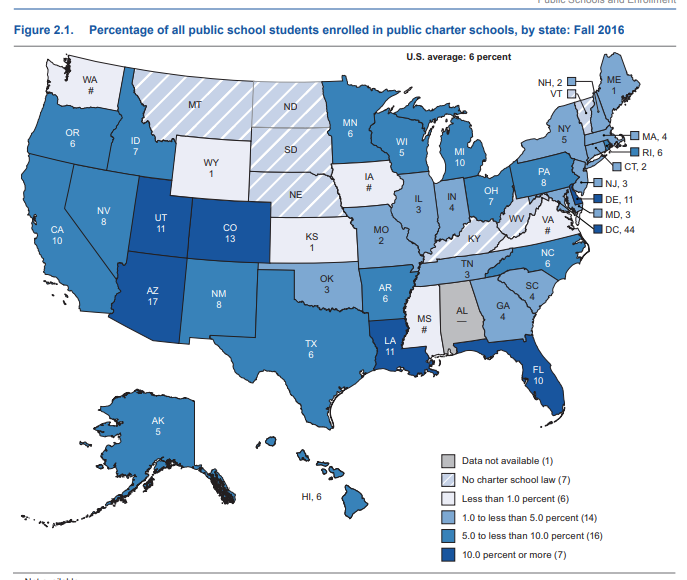
Enrollment in charter options varies greatly among states, though one important pattern emerges just in time for the Democratic presidential primaries: Important swing states Florida, Arizona and Michigan have large charter school populations.
Meanwhile, the USDOE reports “no measurable difference” between the average district students and charter school students on the National Assessment of Educational Progress (NAEP) exams in reading in math in 2017.
Charter school students, including black, Hispanic and free and reduced-price lunch students, saw higher raw NAEP scores in fourth-grade reading than in traditional public schools, and were no different on eighth-grade reading. White, black and Hispanic students attending charters also saw higher raw scores on eighth-grade math, and were no different on fourth-grade math.
According to the report, 1.7 million students attended a home school setting in 2016. Home school students were more likely to live in a rural setting or small town than be urban or suburban. Homeschooling was also more common in the South and West than in the Northeast.
Home school parents had various reasons for choosing the option, according to the USDOE. About 34 percent of home education parents chose home schooling over public schools due to concerns about a school’s environment such as safety, drugs or negative peer pressure. Seventeen percent were dissatisfied with instruction, and 16 percent wanted to provide religious instruction.
Choice also played a significant role in parental satisfaction. Sixty percent of parents choosing a public school option were satisfied with the school, compared to 54 percent of parents with students at assigned public schools. Seventy-seven percent of parents enrolling children in private schools reported being satisfied with the school. A similar pattern emerges regarding satisfaction for academic standards, school discipline and regarding interaction between staff and parents.