Last week, the Heritage Foundation released a study from yours-truly called From Mass Deception to Meaningful Accountability: A Brighter Future for K–12 Education. The basic argument: the good intentions of the No Child Left Behind era were completely undermined by opponents, who both defanged state rating systems and tamed charter school laws. On the first assertion, I offered charts like:

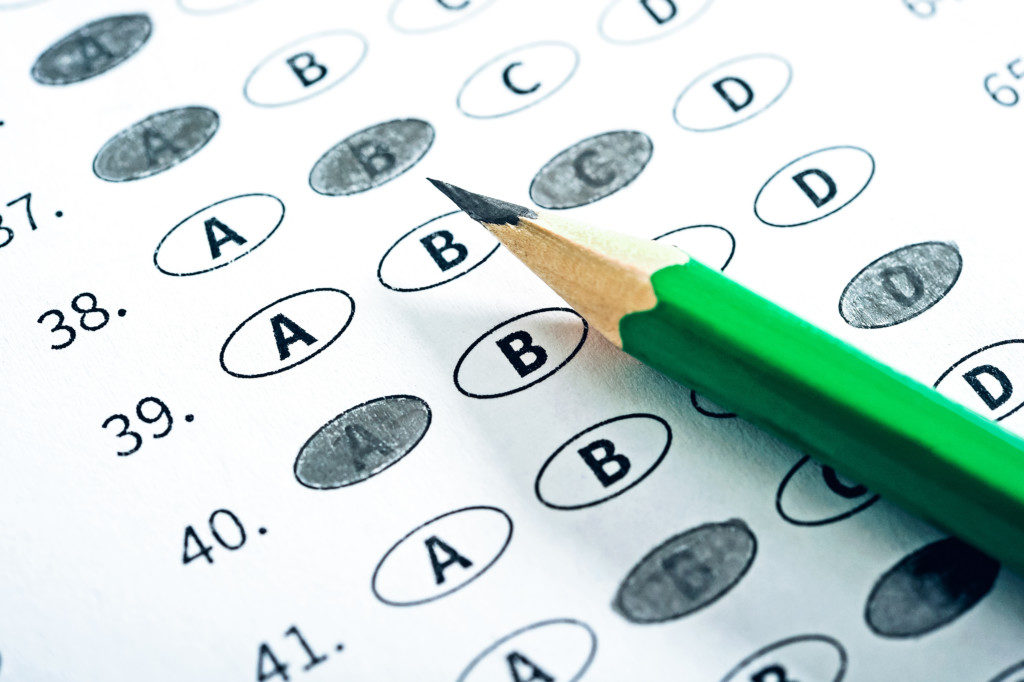
Ooof, and even worse this comparison between Arizona’s school grades in Maricopa County and GreatSchools private ratings for schools within 15 miles of Phoenix (the closest approximation on the GreatSchools site) after converting the GS 1-10 ratings onto a A-F scale:
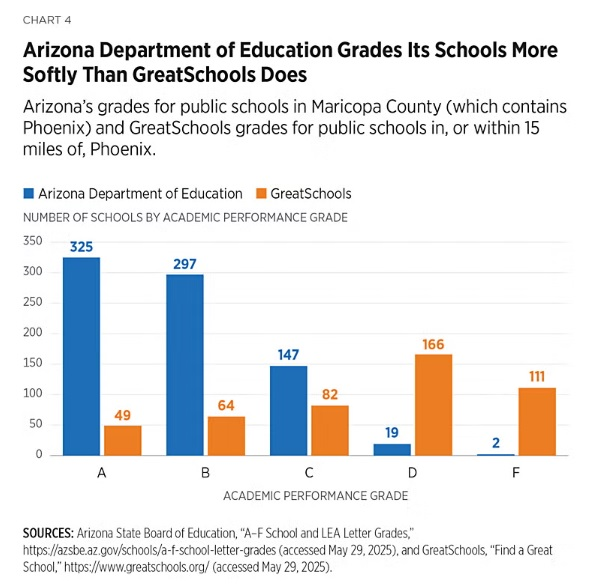
Charter schools always and everywhere had waitlists, ergo, accountability amounted to “trophies for everyone” state systems and charter school sectors that never matched demand with supply. Take a look at the above chart, however, and you’ll see that GreatSchools is a much, much tougher grader than the state of Arizona. The usual suspects have a much tougher time undermining private rating organizations, and they gather reviews (which research shows families value). Ergo the backgrounder makes the argument that we should not rely upon state rating systems in preference to the already superior, more trusted and versatile private efforts. Furthermore, we should expand rating systems into the broader universe of education service providers active in today’s ESA and robust personal use tax credit programs, specifically to gather reviews accessible to families for purposes of navigating the wide world of choice, which we need much more of.
Okay so a couple of reader requests. First, I was asked if I could create something like the Phoenix chart for a district in Florida. I chose Miami:

So not as much of a contrast as Arizona but…if I were looking for a school in Miami, I would look at GreatSchools.
Next, I received a request about this chart from Sandy Kress:

Putting the NAEP improvement numbers in context: In the 2024 NAEP, the total across the four mathematics and reading exams between the highest scoring state (MA) and the lowest scoring state (New Mexico) was 10%. So, the nation-leading 5% improvement in Mississippi scores should be seen as meaningful. Sandy asked me to look at an earlier period from the mid-1990s until 2011 rather than the 2003 to 2019 period, as his contention was that that period saw a lot more academic improvement before the federal law was defanged on a bipartisan basis during the Obama administration.
All states began taking NAEP in 2003, so stretching back to the 1990s loses a number of states. Also, 1996 didn’t include the two reading tests, so I substituted 1998. Nor can we automatically attribute the trends exclusively to standards and accountability (other things also going on), but Sandy is correct that NAEP showed a lot more academic improvement during those earlier years:
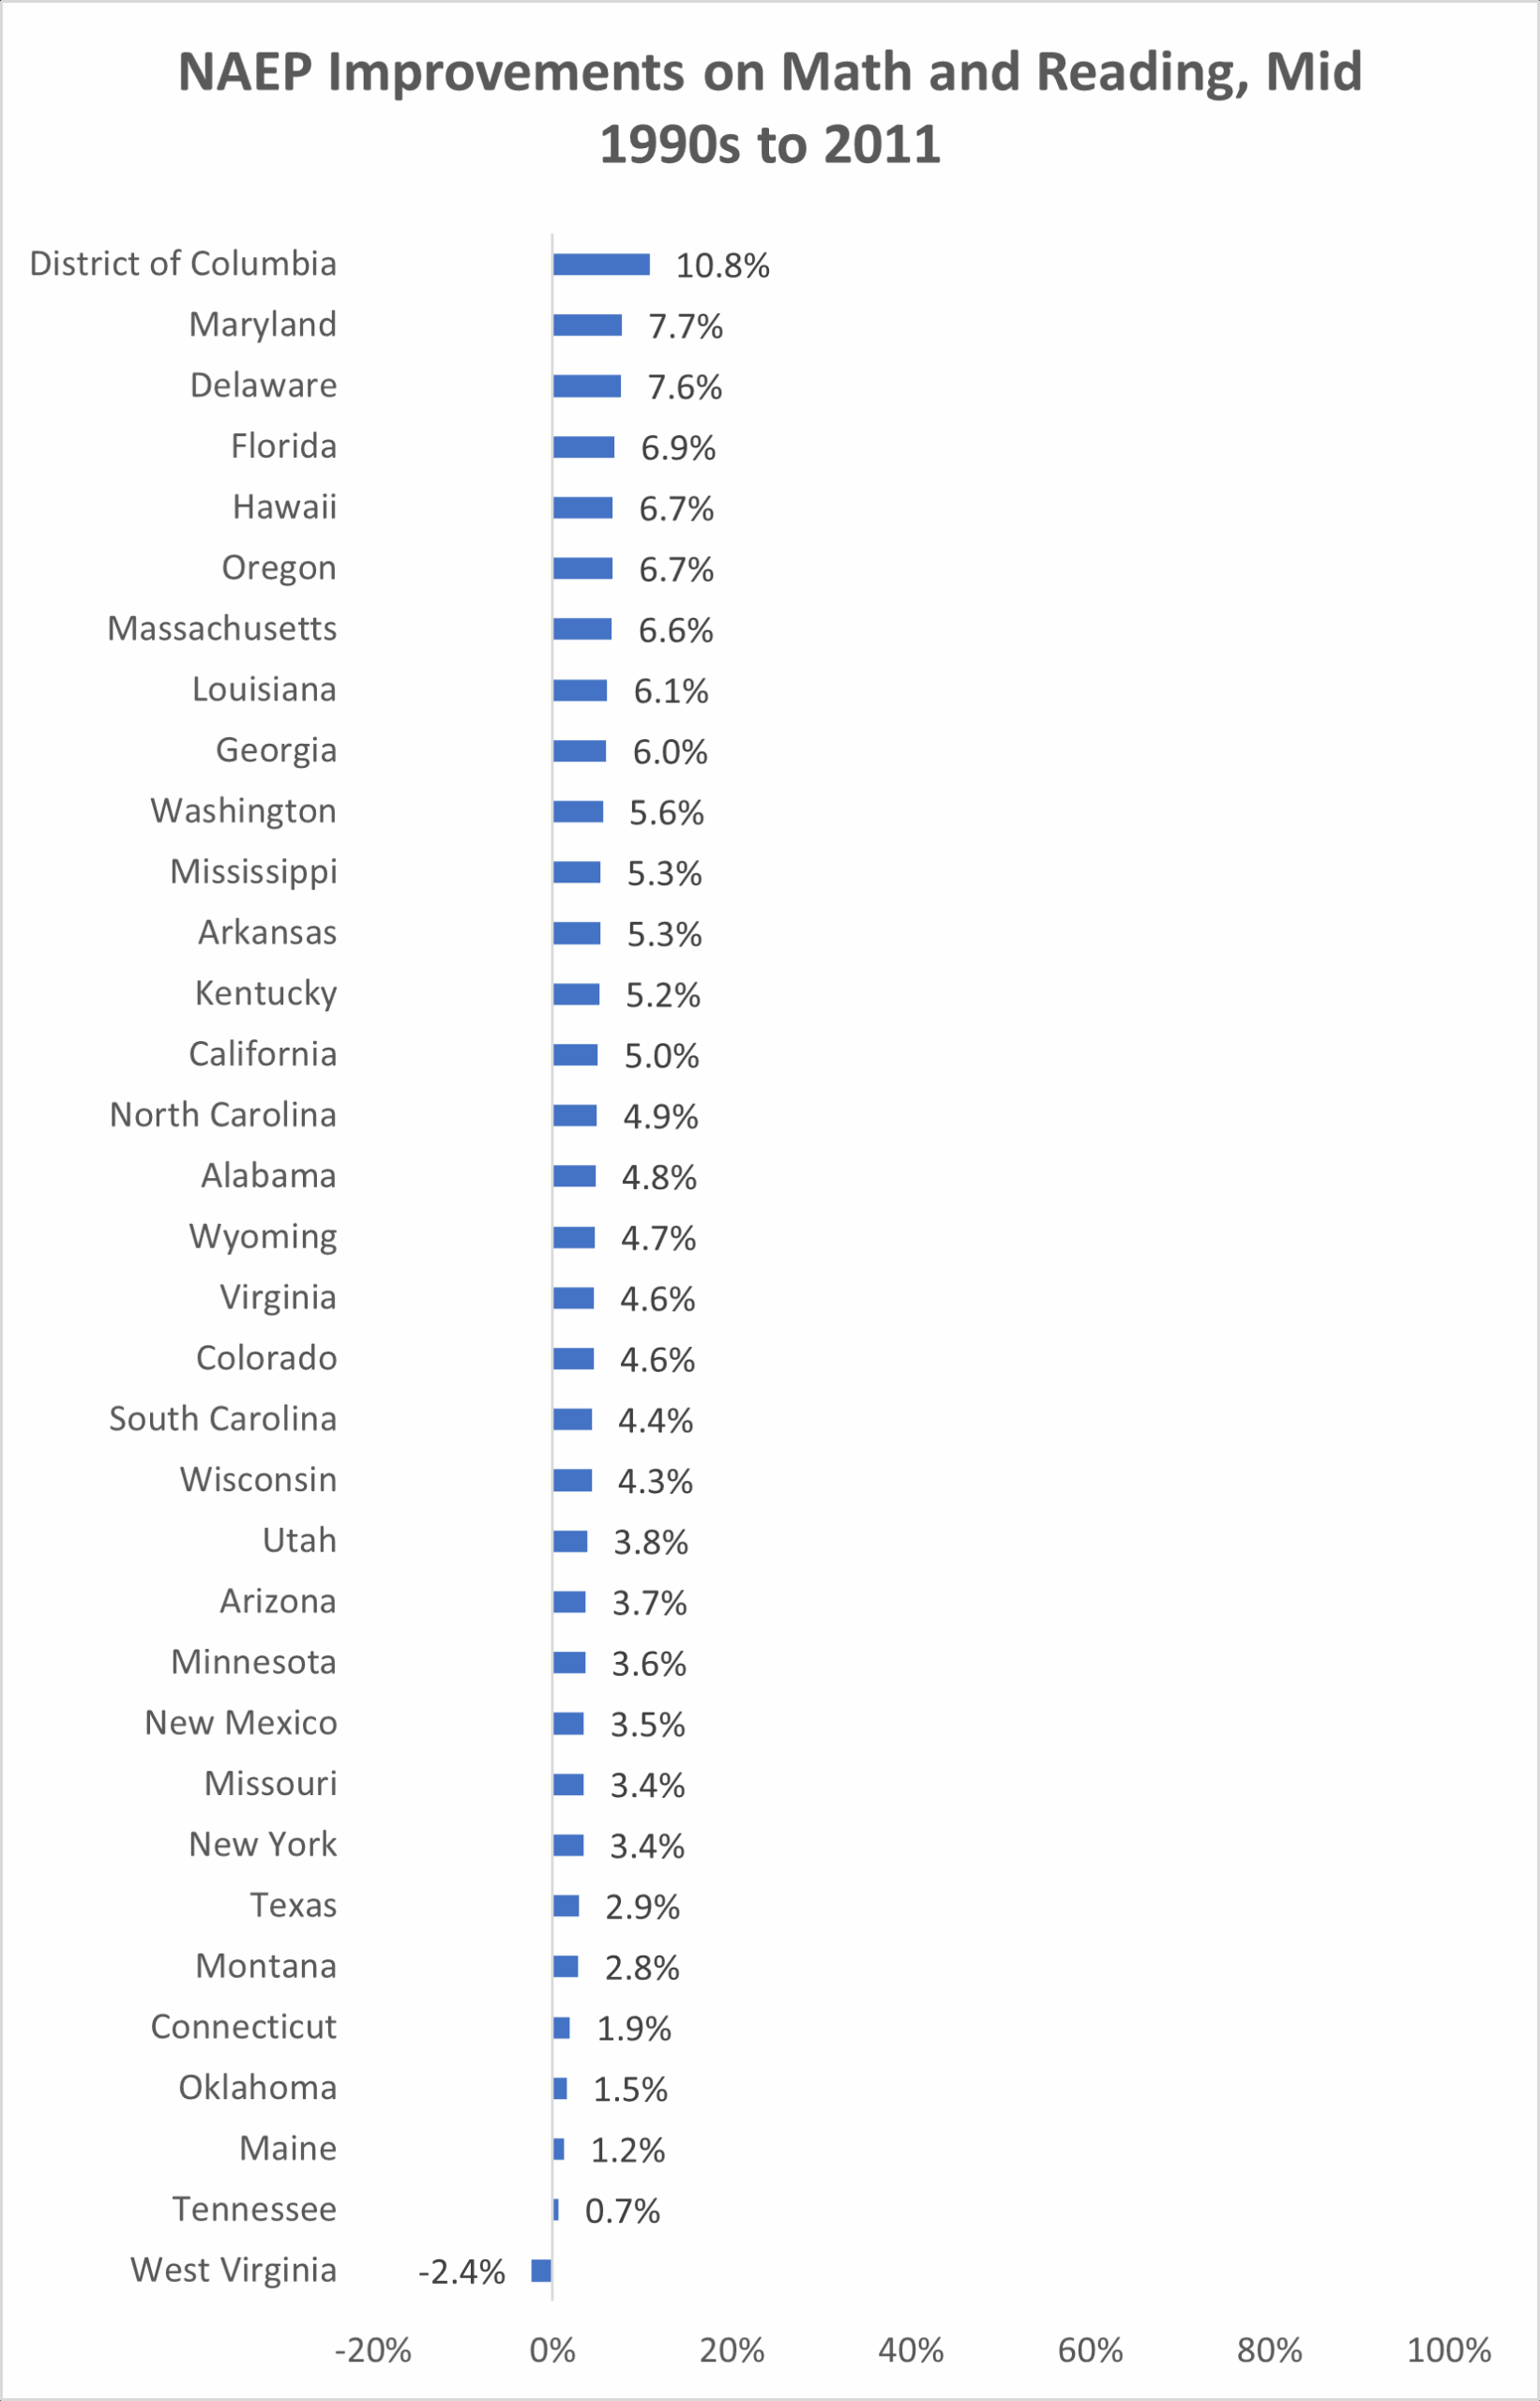
Accountability hawks/the federal government may have indeed coaxed more productivity out of the public school system. Then on a bipartisan basis, Congress removed federal pressure (passed the Senate 85-12 and the House 359-64). Subsequently a large majority if (perhaps?) not every single state merely went through the motions of “accountability” with trophies for (almost) everyone. Kress can justifiably look at these data to claim, “the juice is worth the squeeze” and I can look at the same data to say, “academic transparency is too important to leave to politicians and their appointees.”
Franklin Roosevelt noted ““It is common sense to take a method and try it. If it fails, admit it frankly and try another. But try something.” Every state in the union remains entirely free to adopt tough accountability practices, but apparently few if any have chosen to do so. The next something to try in my opinion are enhanced private rating systems and robust choice programs. Temporarily semi-tough accountability systems run by states and charter school waitlists ultimately proved to be a strategy with limited political sustainability.
A new report by EdChoice uses parent surveys to identify what parents want from their schools.
The whole thing is worth reading, but I wanted to highlight two key points that jibe with other studies and underscore important challenges for the education choice movement.
Distance matters
![]()
Parents are willing to travel to transport their child to a quality school. But there are limits.
The most common response to EdChoice's surveys was that parents were willing to travel up to 20 minutes to get their child to a school they perceived as high-quality, though some indicated they'd be willing to travel longer.
This underscores a common-sense point that other studies have shown for years: there are practical limits to the school options that families are able to access.
Measures to reduce geographic constraints on families' options, like eliminating residential school assignment, are worth doing. These efforts need to be paired with efforts to provide more flexible forms of school transformation and increase the number of quality options every family can find close to home.
Objective data matters
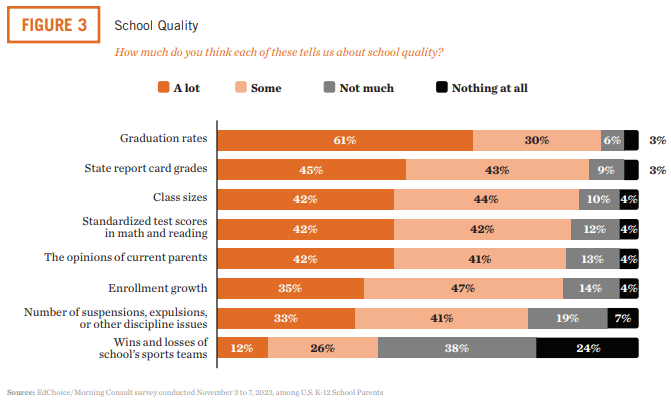
When school systems shift top-down regulatory accountability to accountability driven by family choices, families still want objective information on which schools are effective.
Studies have reached different conclusions about just how much families value test scores, graduation rates, and other quantitative measures of school effectiveness, but the EdChoice results show these indicators matter to families, and that broad point jibes with earlier studies of public-school choice in New Orleans and Washington D.C..
Other research has found that giving parents access to new information, like student growth data, can influence the choices families ultimately make.
This creates a technical challenge for policymakers: How can they ensure families have actionable, comparable data on school effectiveness without imposing mandates that schools take specific assessments that might not align with the unique educational philosophies of diverse learning environments?
The bottom line
If we want to help all families have access to learning options that meet their needs, we're going to need to devise new methods to give families access to objective information about school performance, and to help them overcome logistical barriers to accessing schools of their choice.
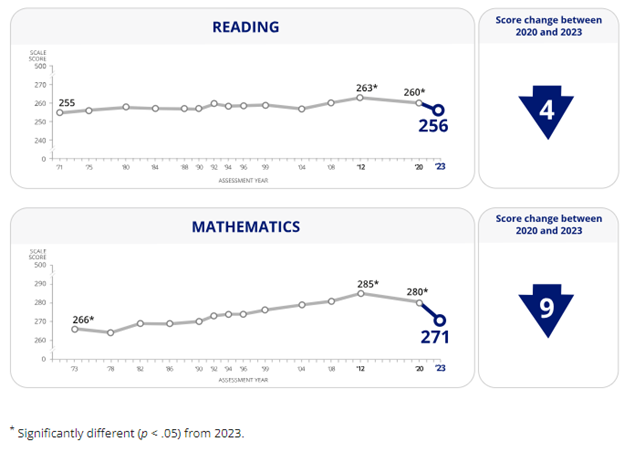
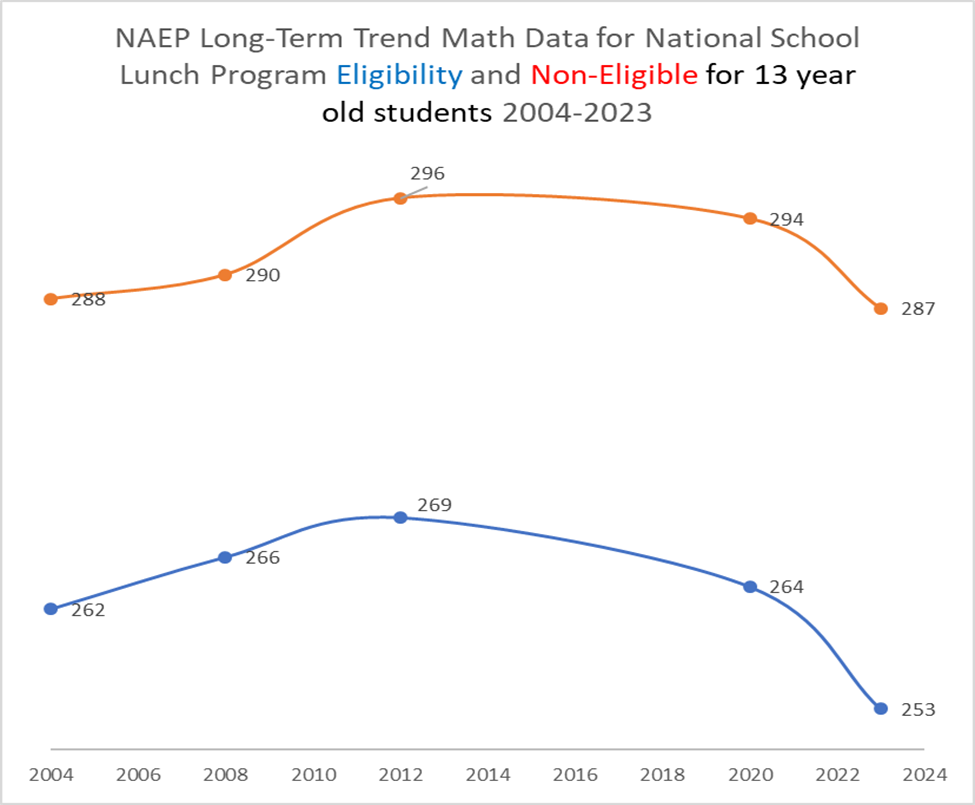
The National Assessment of Educational Progress released Long Term Trend data for 13-year-old students last week. On these exams, 10 points approximately equals a grade level worth of average academic progress. Mathematics achievement has dropped 14 points and reading seven points since 2012. The COVID-19 pandemic accelerated a pre-existing decline. Real spending per student was 160% higher in 2019-20 than in 1969-70, but reading scores are statistically identical (255 in 1970, 256 in 2023). Since 2019, spending has gone to record highs while achievement to near record lows.
The news gets worse when you examine achievement gaps. The chart below shows the mathematics trend by free or reduced lunch eligibility status. The smallest gap stood at a still appalling 24 points in 2008. In 2023 the gap stood at 34 points, the largest on record.
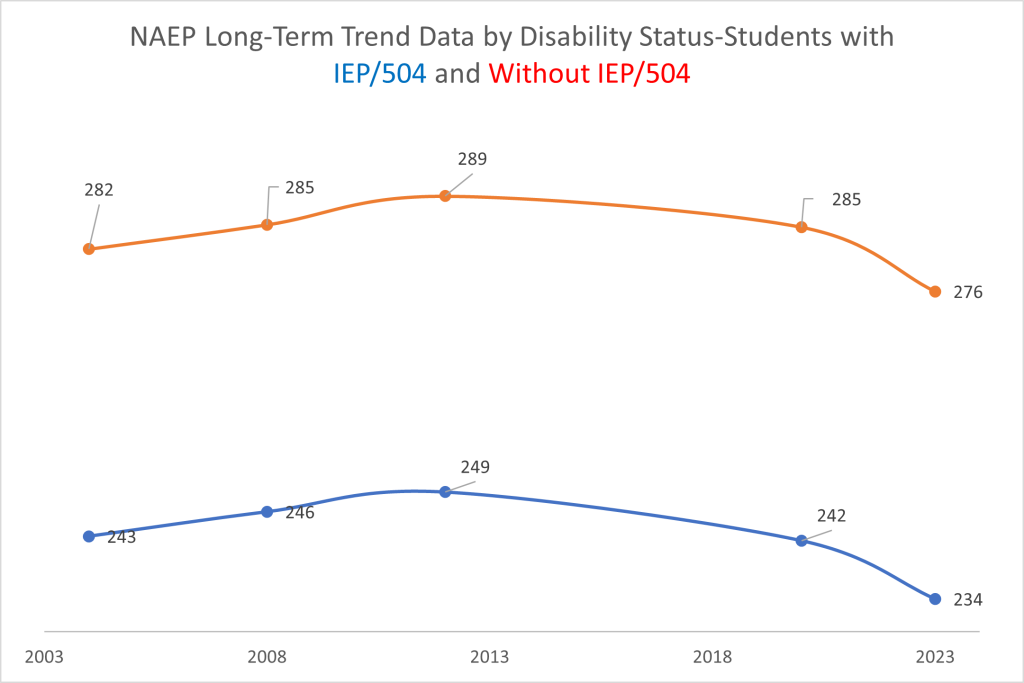
Similar story by disability status- bad for both, worst for IEP/504 plan students.
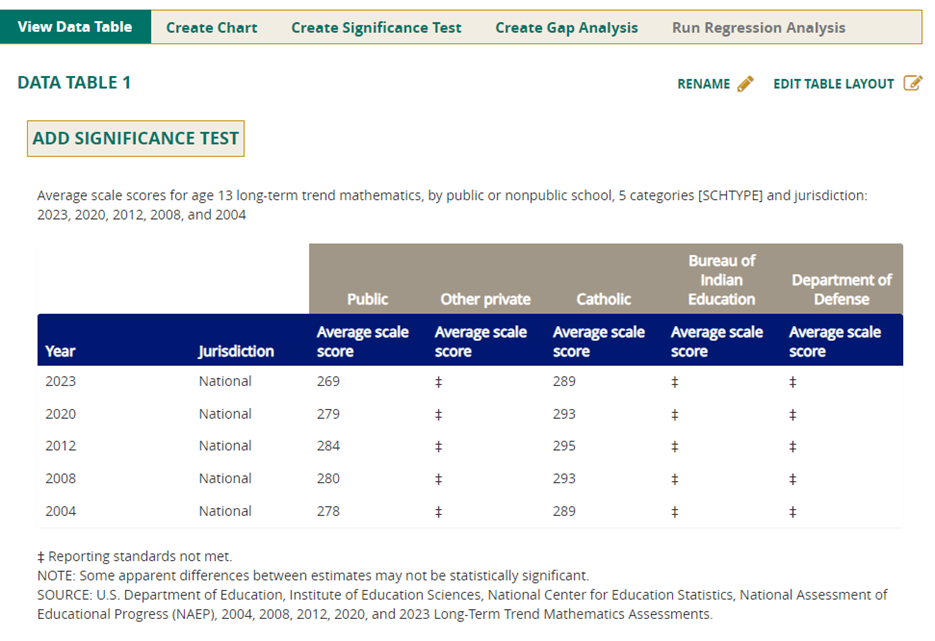
The gap between public school and Catholic school students increased from 11 points in favor of Catholic school students in 2004 to a 20-point advantage in 2023. The advantage for Hispanic students in Catholic schools stood at 23 points higher than their public-school peers.
Now it could be that you are not overly concerned about your child or grandchild learning civics, mathematics or reading. If so the union captured district system has growing numbers of empty seats just for you! As an added bonus, your special little ones can indirectly serve as funding units for some of the most reactionary special interests in American politics today!
Not your particular cup of tea? Well then consider making alternate plans. Millions before you have already done so, and the flight to freedom is just getting warmed up.
Editor's note: This story on the latest scores released from the National Assessment of Educational Progress originally appeared Wednesday in The 74.
COVID-19’s cataclysmic impact on K–12 education, coming on the heels of a decade of stagnation in schools, has yielded a lost generation of growth for adolescents, new federal data reveal.
Wednesday’s publication of scores from the National Assessment of Educational Progress (NAEP) — America’s most prominent benchmark of learning, typically referred to as the Nation’s Report Card — shows the average 13-year-old’s understanding of math plummeting back to levels last seen in the 1990s; struggling readers scored lower than they did in 1971, when the test was first administered. Gaps in performance between children of different backgrounds, already huge during the Bush and Obama presidencies, have stretched to still-greater magnitudes.
The bad tidings are, in a sense, predictable: Beginning in 2022, successive updates from NAEP have laid bare the consequences of prolonged school closures and spottily delivered virtual instruction. Only last month, disappointing results on the exam’s history and civics component led to a fresh round of headlines about the pandemic’s ugly hangover.
But the latest release, highlighting “long-term trends” that extend back to the 1970s, widens the aperture on the nation’s profound academic slump.
To continue reading, go here.
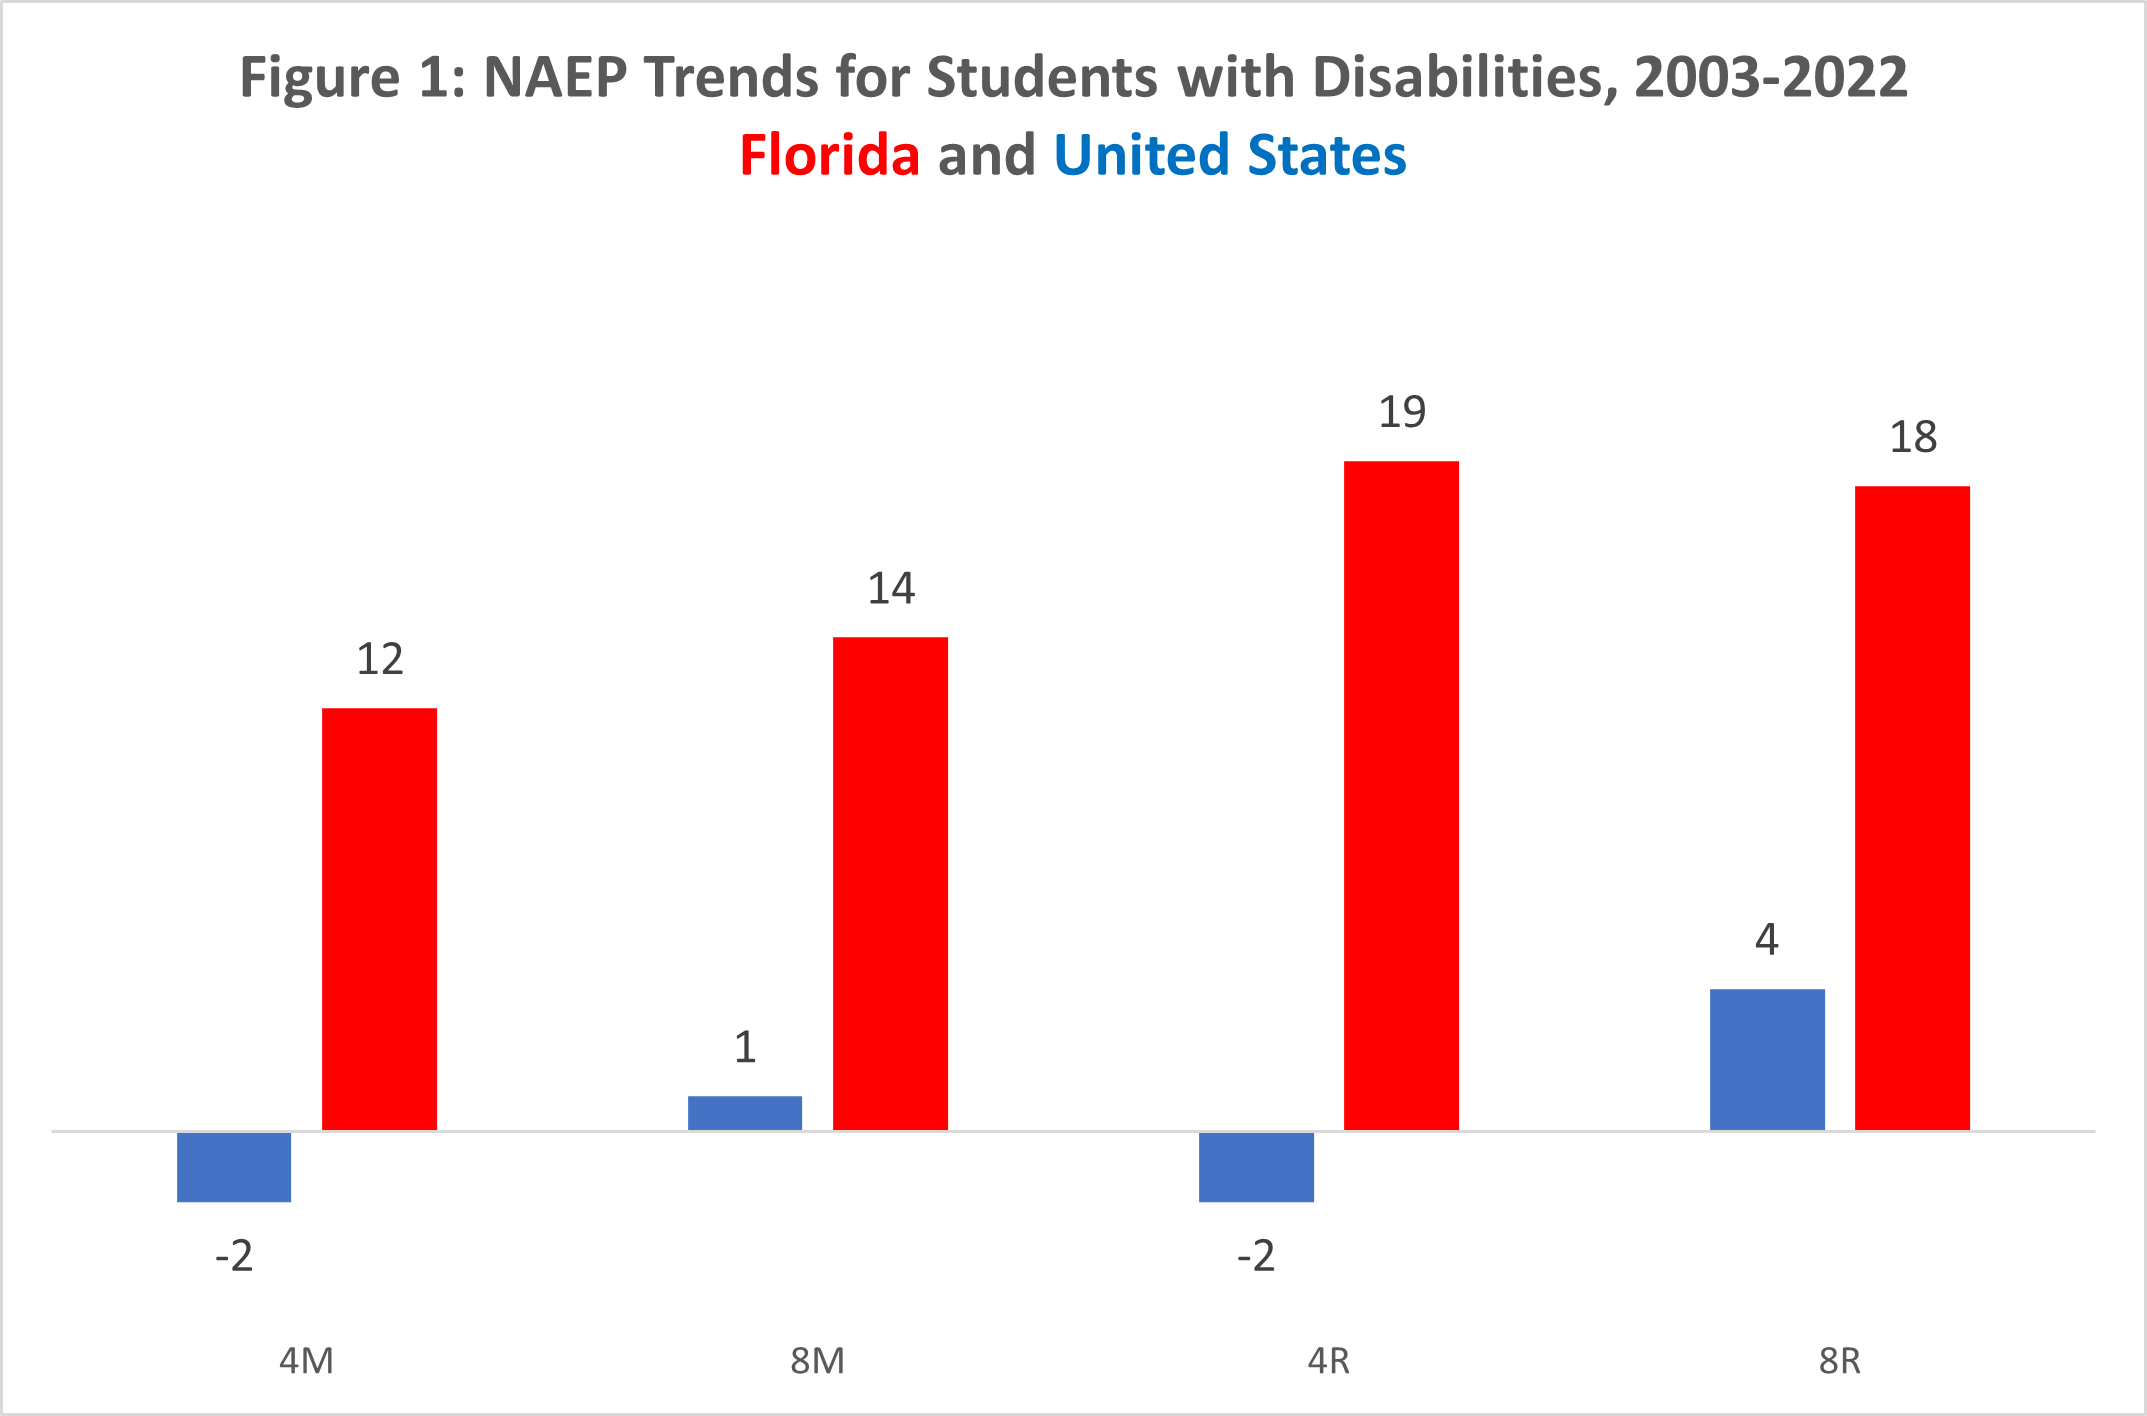
If you take the Nation’s Report Card data back as far as it will go to capture all 50 states (2003) and up until the most recent exams (2022), the trends for students with disabilities look like the chart above. For the United States across four exams you get a net 1-point increase. Let’s call that the midpoint between “spinning your wheels” and “playing in your food” spectrum. Meanwhile Florida made a net 63 points of progress, a grade level or more on each of the exams. A suite of reforms seems to have helped drive this progress.
Florida Gov. Jeb Bush’s reforms started in 1999 and included the creation of the nation’s first private choice program for students with disabilities. You can examine Figure 1 above and ponder whether the continual predictions of doom made by choice opponents seem the
least bit credible. Florida lawmakers created a separate education savings accounts, or ESA program, for students with unique abilities before consolidating the programs. Florida’s students with disabilities have had more choice access for a longer period of time than students in any other state.
Florida’s policies with a plausible connection to academic progress for students with unique abilities don’t end with choice. Florida pioneered the grading of schools A-F. Crucially, the Florida formula double weights the academic gains of the bottom 25% of students on the previous year’s state standardized exams.

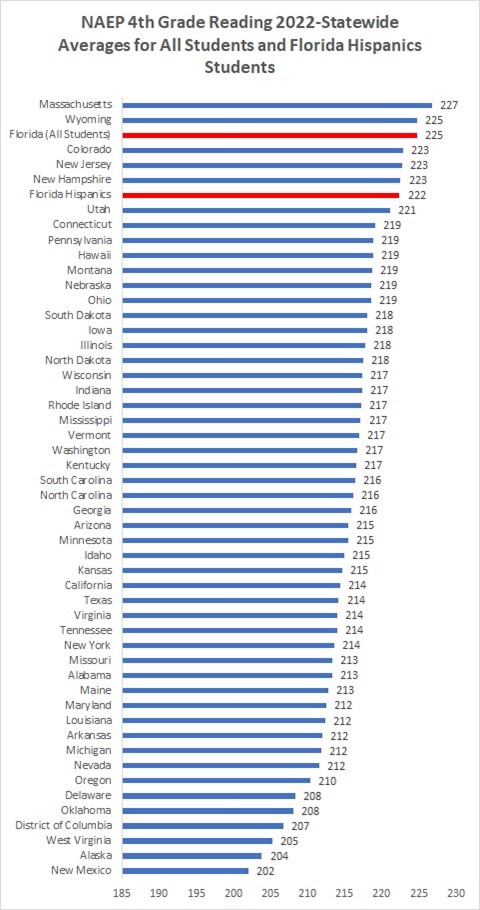
Recently I reported that Florida’s students with disabilities exceeded multiple states statewide averages for all students on multiple 2022 NAEP exams. This is both encouraging (for Florida) and disturbing for much of the rest of the country. But wait the news gets better (worse) still.
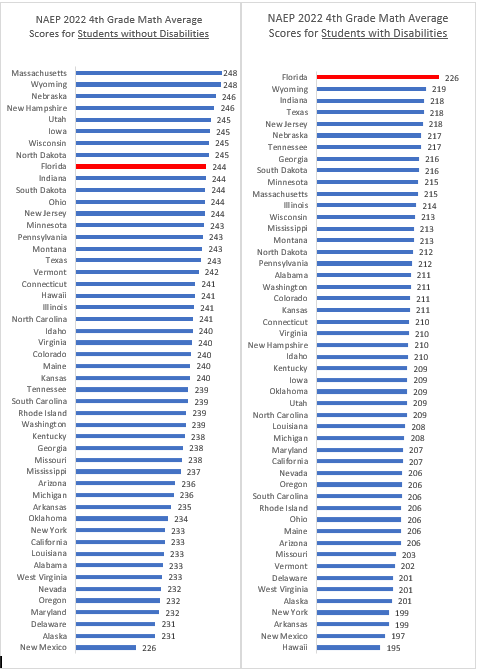
Above are charts showing NAEP fourth grade math scores for both students without disabilities (on the left) and those students with disabilities (on the right). Nationwide the average achievement gap between students without disabilities and students with disabilities was 38 points, and the gap varies between states.
Notice that Florida, marked in red, ranked first for students with disabilities and ninth for students without disabilities. Now look a bit closer. See it yet? Let me help you out:
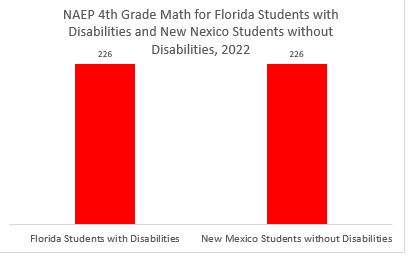
I’ll leave it to you dear reader as to whether you prefer to marvel at the improvement in outcomes for students with disabilities in Florida, lament the outcomes in New Mexico, or both. Put me down for “both” please. Just in case you are tempted to write this off to some kind of COVID-era fluke, it actually happened before in 2005 and very close to happening in 2009, long before the pandemic.
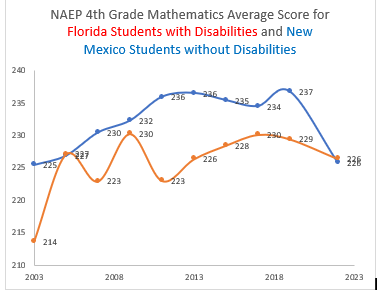
As noted earlier, Florida provides a relatively large amount of choice to both students with disabilities and students generally. Florida has also spent decades of effort in promoting sound reading instruction for all students. New Mexico’s public education system seems much more focused on generating adult salaries and pensions.

Welcome to a new kind of tension
All across the alien nation
Where everything isn't meant to be okay
-Green Day, American Idiot
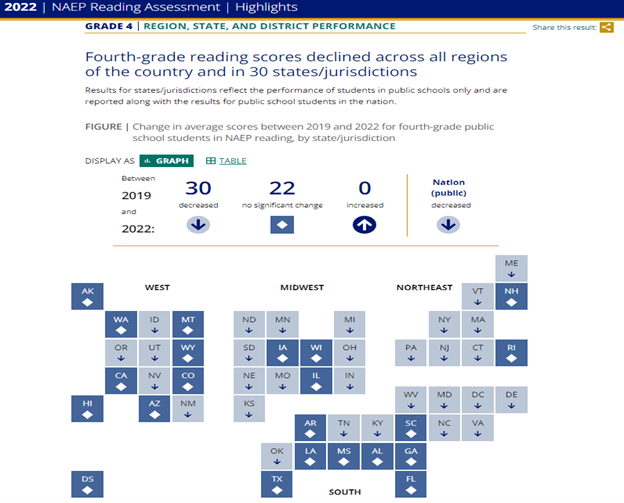
NAEP’s 2022 state release had catastrophic news on the math front, but it should not overshadow the very bad news on reading. Reading wasn’t exactly trending in a positive direction before the COVID-19 pandemic, and the last thing the country needed was to accelerate that trend. In a majority of states, sadly that is exactly what happened. NAEP released the below modern-art maps showing 2019 to 2022 trends in fourth grade reading by state. A down arrow signifies a statistically significant decline in scores, a star no significant change.
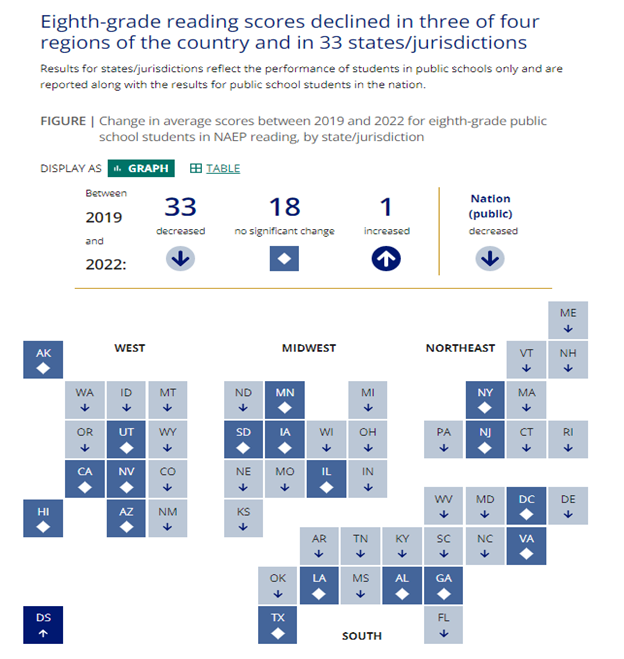
And here is the map for eighth grade reading:
Let’s just get right to the harsh realities part of the post: reading deficits are very difficult to remediate, and the public school system is not designed to detect and remediate academic deficits in any kind of broad fashion. Not to say that it never happens, rather that for decades young Americans score better on international exams than middle school Americans. They’ve acquired unaddressed deficits, and then many go on to drop out and/or require remediation after high school. There have been some efforts at remediation, such as Arizona lawmakers paying for 100,000 students to attend summer camps in 2022 (after the NAEP). Gov. Doug Ducey has announced they will repeat the camps in 2023.
America will be less literate, less numerate, and poorer in the long run. There are federal billions lying around in school district accounts, and just look at the maps above to see how effectively they have been used thus far. If you have school-aged children or grandchildren, I can only recommend that you investigate private tutoring services. If you are waiting around hoping the public school system will clean this up, you are making a terrible mistake. Don’t want to have an American illiterate? You’ll need to take matters into your own hands.
NAEP released 2022 state and large urban district data early this morning. Scores dropped in all four tested subjects (fourth and eighth grade math and reading) almost across the board. Nationally the drops were -3, -3, -5 and -8 points on fourth grade reading, eighth grade reading, fourth grade math and eighth grade math, respectively, from 2019. On these exams 10 points approximately equals a grade level of average progress, and the scores in 2019 were also generally down.
Florida’s scores fell in both math exams, held steady on fourth grade reading and declined modestly on eighth grade reading.
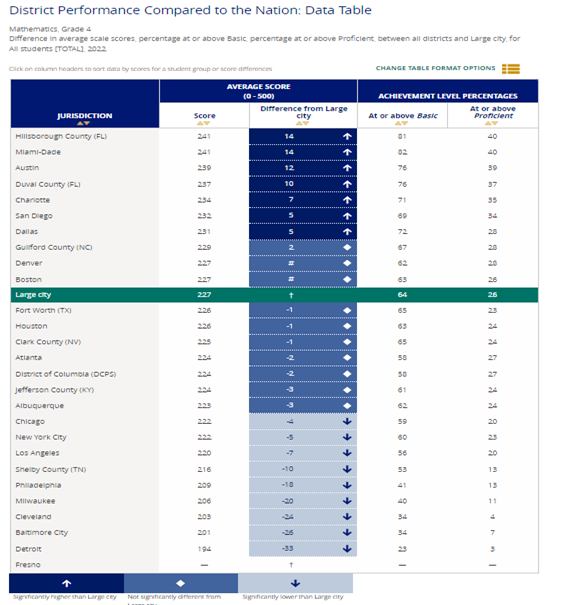
Some bright spots: Florida’s fourth grade reading performance still shines. For example, on the Trial Urban District Assessment (TUDA- the NAEP for select large urban districts) the three Florida districts ranked first, second and third with differences 14, 14 and 10 points above the national average for large cities nationwide. Florida students ranked third on fourth grade reading in 2022, and if Florida’s Hispanic students ranked seventh compared to statewide averages for all students.
Charter school students and students with disabilities also appear to be relative bright spots for Florida, but the overall challenge on the math front is considerable. And nationally the news is nothing short of a catastrophe, as you can see in the chart below by state:
If there is a silver lining here, it is that math is not as difficult to remediate as reading. Given these huge deficits and the even more gigantic amounts of unspent COVID-19 funding, let’s just say that a sense of urgency has been noticeably lacking. If you have children or grandchildren, I would advise you to get them to a math tutoring service ASAP- don’t give the system the chance to let them down again. Florida pioneered a micro-grant for the purposes of reading remediation; lawmakers would do well to do the same for mathematics.
Charter schools and home schooling are experiencing major growth. Meanwhile, there were no significant differences between students in charter schools and traditional public schools in average reading and mathematics scores on national tests in 2017.
Those are two of the key findings in the U.S. Department of Education’s (USDOE) latest report, “School Choice in the United States,” which updates the national changing landscape for school choice with changes in enrollment data, academic performance updates, and parental satisfaction surveys. Nationally, charter public schools and district schools increased enrollment while private schools declined.
Overall, there were around 57.8 million K-12 students in the United States, up from 53.8 million in 1999. Based on figures from the USDOE, the market share of district schools fell from 87 percent of all students in 1999 to 81.8 percent of students by 2016.
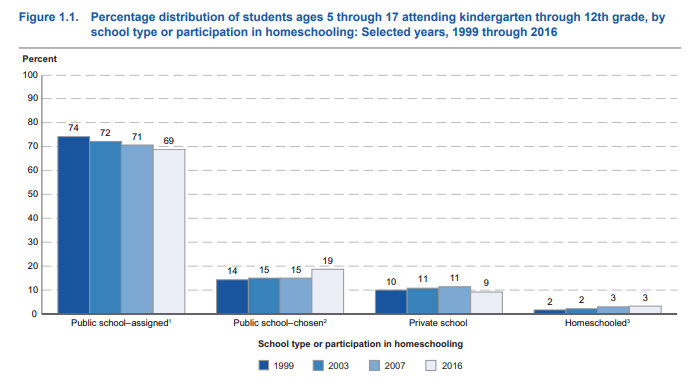
From 1999 to 2016 the share of students attending their assigned neighborhood public schools dropped from 74 percent to 69 percent. Public school choice option, including charter schools, magnet schools and open enrollment programs, grew from 14 percent of the student body in 1999 to 19 percent. Charter schools alone grew a staggering 571 percent from 2000 to 2016, enrolling over 3 million students by 2016.
Private school options fell from 10 percent to 9 percent, while home education grew from 2 percent to 3 percent by 2016.
Unlike most of the nation, however, Florida has seen private school enrollment bounce back. In 2000, 348,000 students enrolled in nonpublic schools, comprising 12.5 percent of the total PK-12 student body. Thanks to the help of several private school programs, including the Florida Tax Credit Scholarship, private schools in the Sunshine State continue to grow. In 2018-19, the latest data available, 380,000 students enrolled in nonpublic schools, though the market share has declined to 11.8 percent of Florida’s total PK-12 student population.
Catholic schools remain the top choice among private school parents, enrolling more than 2 million students in 2016, more than double any other denomination.
District schools enrolled 94 percent of all public school students, with charters enrolling the other 6 percent. District schools were more likely to enroll white students, and less likely to enroll black or Hispanic students, than charters. According to the USDOE, 57 percent of public schools were 50 percent or more white, while just 33 percent of charters were. Charters were more likely to be 50 percent or higher black or Hispanic, however.
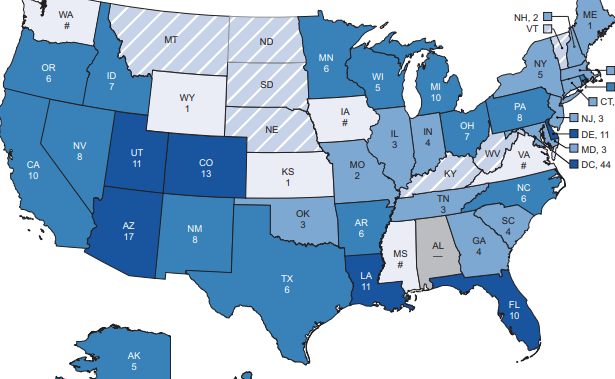
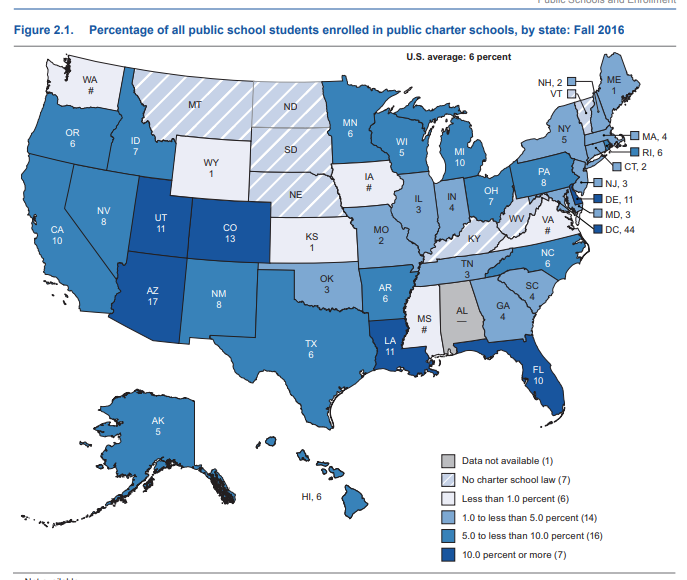
Enrollment in charter options varies greatly among states, though one important pattern emerges just in time for the Democratic presidential primaries: Important swing states Florida, Arizona and Michigan have large charter school populations.
Meanwhile, the USDOE reports “no measurable difference” between the average district students and charter school students on the National Assessment of Educational Progress (NAEP) exams in reading in math in 2017.
Charter school students, including black, Hispanic and free and reduced-price lunch students, saw higher raw NAEP scores in fourth-grade reading than in traditional public schools, and were no different on eighth-grade reading. White, black and Hispanic students attending charters also saw higher raw scores on eighth-grade math, and were no different on fourth-grade math.
According to the report, 1.7 million students attended a home school setting in 2016. Home school students were more likely to live in a rural setting or small town than be urban or suburban. Homeschooling was also more common in the South and West than in the Northeast.
Home school parents had various reasons for choosing the option, according to the USDOE. About 34 percent of home education parents chose home schooling over public schools due to concerns about a school’s environment such as safety, drugs or negative peer pressure. Seventeen percent were dissatisfied with instruction, and 16 percent wanted to provide religious instruction.
Choice also played a significant role in parental satisfaction. Sixty percent of parents choosing a public school option were satisfied with the school, compared to 54 percent of parents with students at assigned public schools. Seventy-seven percent of parents enrolling children in private schools reported being satisfied with the school. A similar pattern emerges regarding satisfaction for academic standards, school discipline and regarding interaction between staff and parents.
Measuring a child’s mastery of material taught in school is plainly reasonable, often necessary. To a point the same may be said of the ceaseless effort of statisticians either to equate or distinguish groups of children by scores on standardized tests.
Today a throng of experts, pro and con to parental choice, compare scores made by children who remain in their assigned “public” schools with those of former classmates who by parental choice have left for a charter or private school. The lower average scores of those who remain are then explained by defenders of the old system as a function of pre-existing social and other differences in the families. Simply put, the kids who get switched are ahead to begin with, either by nature or nurture.
Though myself a choice partisan, I concede some value to such accounts (if true) of the old-order schools and their parents’ decision when empowered. No doubt, social and intellectual differences could affect which families decide to try something new. The same inquiry should disclose which chosen schools are selective in admissions, and to what extent. These realities are worth knowing for diverse reasons apart from choice itself.
In any case, as argued below, there is many a better rationale for parental control than its ability to raise scores (no one claims choice does harm). Sadly, and paradoxically, the pro-choice folks have allowed and encouraged the test rage to flourish, swallowing the critics’ bait, thus narrowing public discourse, and with it the average citizen’s access to the more human justifications for investing poor parents with that power that the more comfortable among us cherish and take for granted.
Nor is this media habit confined to pulp and TV. Recently I discovered 20 pages in an April 2019 edition of The Economist devoted principally to an international assessment and comparison of scores. Its authors seem to assume throughout that “successful” testing provides our primary justification for subsidizing parental choice. Only near the very end do they refer, and then but vaguely, to the range of personal and civic values at stake:
“Above all, government should stop regarding private education as an enemy. Its growth is the
result of people’s deepest urge: to look after their children.”
Were they to review a recent piece in The Wall Street Journal, the Economist authors could well decide to reexamine and expand their brief observation. The WSJ confirms then extends their brief insight, describing a Barbados experiment with 7,000 public pupils who had test scores just above and below an arbitrary median point. Those parents of the higher-scoring group received tuition grants for private schools. Both groups were followed over a period of years, then reexamined.
The result: Children transferring to private schools had no higher scores over time, but their rates of graduation, college enrollment and completion, plus other “real life” outcomes were markedly higher. The conclusion: Parents prefer schools that teach values, morality and character, wanting their children to “be not only good students but good people.” The later life records of these same children are reported as remarkably richer than those left behind, in both economic and human terms – and in sheer happiness.
Choice awakens in the parent all those values, personal and civic, that can be realized only upon social recognition and protection of that wide responsibility and authority that law perceives to dwell in all rational humans over their own affairs and those of their own children. In the act of parental decision, that truth is passed to the consciousness of the child himself, confirming the unique dignity and hope that is experienced primarily in close family relations. In our context of school choice, when the child experiences something good or bad, he has a true audience which has the power to judge and, if necessary, make changes.
The real payoff from choice will come only over time – and with many a sad incident – as the poor gradually recognize this new reality and begin to reoccupy their zone of human independence so long shanghaied by the state and the teachers union. Parents will make mistakes, but for the first time realize their capacity to correct and learn from them instead of supinely accepting that one incorruptible mistake made for them by a faceless government authority. “Yes! Let’s try that New Hope school for Johnny next year!”
Parents with authority to choose will encounter, for the first time, educators who in self-interest must take them seriously, dealing with them as the free agents they are, all engaged in a join project. Seeing the relevance of their own lack of sophistication, many mothers and fathers will commence a self-education about schools, seeking deliverance from any previous mistakes that they now have the chance to avoid. There will be government, private, and religious sources ready to assist.
Sophistication will not come in a hurry nor be true of every parent. Such is the reality of man’s experience with extending civic trust to adult humans. But by stages most of us come to recognize and accept our role as responsible members of society. Raising test scores certainly is a worthy goal. But realizing the responsibility and dignity of the not-so-rich parent (and thus, the child) will be the true payoff of school choice. And may more voices, public and private, start saying so!