 Editor’s note: This commentary from Jay Mathews, an education columnist for the Washington Post and creator of the annual Challenge Index rankings of American high schools, appeared Sunday on washingtonpost.com.
The current debate over schools puzzles me. Much of the talk is about the need for more parent rights and more parent choice. Some people fail to recognize that parental decisions are at least as, if not more, important than anything else going on in schools these days.
Parents want their children to acquire skills that will pay their bills and develop resourcefulness to handle tough times in their lives. Parents look for schools with good teachers who can help with that.
Most make their school choices based not on their politics but on what is going on in those classrooms.
The alleged lessons on race and sex that are being debated don’t matter to them as much as progress in reading and math.
Decades of educational research show that increased achievement in our schools is tied to rising living standards. The fact that parents have been working hard, doing better financially and supporting school improvements helps explain significant gains in U.S. learning from 1971 to 2017, according to researchers M. Danish Shakeel and Paul E. Peterson.
The pandemic has set that back, but there has been no decline in parental eagerness for good teaching. Mothers and fathers will demand that schools recover the gains lost and won’t rest until that happens.
Parents often gravitate to schools in the most affluent neighborhoods, where average test scores are high. But that focus on nice suburbs overlooks what is happening in communities on the other end of the income scale.
The largest and one of the most academically successful public charter school networks in the country is KIPP. It began in 1994 with 49 students in one elementary school classroom in a poor part of Houston. Today, it has 120,000 students, 88% of them low-income.
The similarly high-scoring IDEA public charter network began in 1998 with 75 mostly low-income students in Donna, Tex., near the Mexican border. That network now has 80,000 students, 87% of whom are economically disadvantaged.
How did those students get into those great schools? Their parents enrolled them. Mothers and fathers recognize that KIPP and IDEA are among several charter networks, and some regular public schools far from rich neighborhoods, distinguishing themselves academically.
To continue reading, click here.
 The National Assessment of Educational Progress (NAEP) released “the nation’s report card” recently, which included fourth and eighth grade Math and Reading results for 2022. The results can only be described as devastating.
 Closing the achievement gap between Black and white students has long served as an aspiration of the education reform movement, but gap closing is a problematic concept. States can – and have – closed gaps as evidenced by NAEP scores by having all students do worse over time, but relatively advantaged groups decline at a faster rate.
This is in no way desirable; it’s best to focus on gains for disadvantaged students.
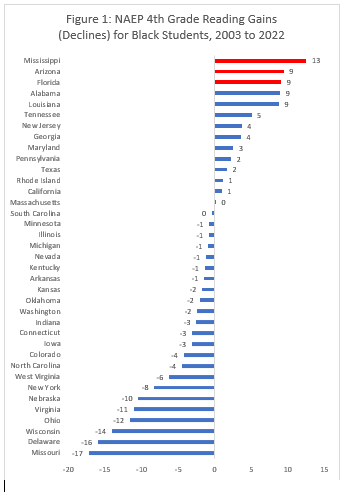
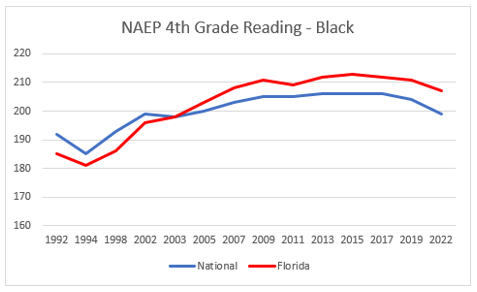
The chart above shows the academic trend from 2003 (the year all states began taking NAEP exams) to the most recent exams in 2022 for fourth grade reading for Black students. Note that on this test, 10 points roughly equals a grade level of average progress.
Mississippi shows admirable nation-leading progress; I have highlighted the top three performers (Mississippi, Arizona and Florida) purposefully.
Mississippi’s literacy strategy has been rightly and broadly praised. The main thrust of Arizona’s education reform strategy, meanwhile, involves the promotion of school choice. Arizona has adopted other reforms like school grading and third grade retention, but these strategies have been poorly executed, with grades getting turned on/off repeatedly and lacking surface credibility, and a third grade literacy gate that is wide open to illiterates to proceed (vanishingly few students retained).
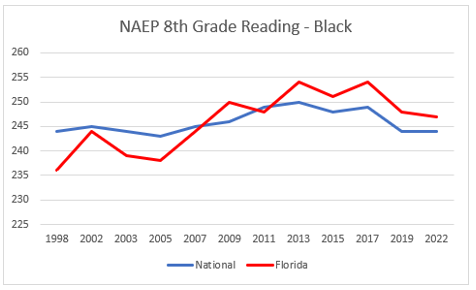
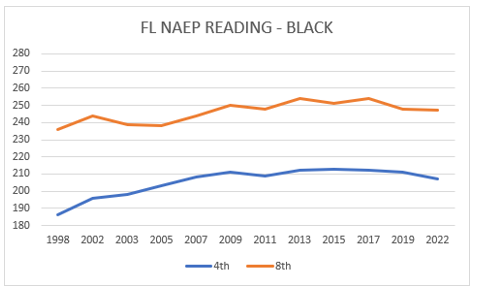
The chart below shows the fourth grade reading trend for Black students between 1998 and 2022.
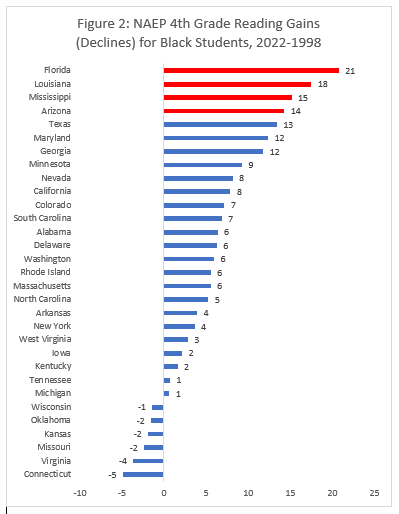 Backing the clock up to just before Florida’s election of Gov. Jeb Bush shows the state’s combined strategy (choice and literacy) is far out in front in driving gains. Note also that Louisiana, another state with a combined strategy, jumps into second place in the 1998 to 2022 chart.
As the kids say, game recognizes game. Choice and literacy strategies are not mutually exclusive, and in fact, each strategy can mutually reinforce the other.
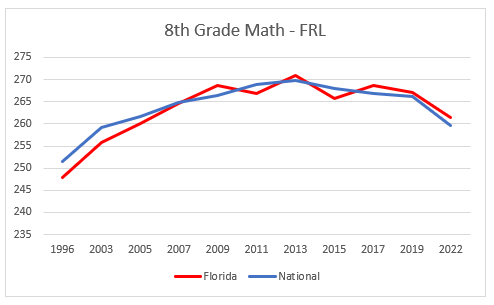
 Florida’s Reading test results in the National Assessment for Education Progress (NAEP) weren’t all bad news, but things look much worse for Math scores.
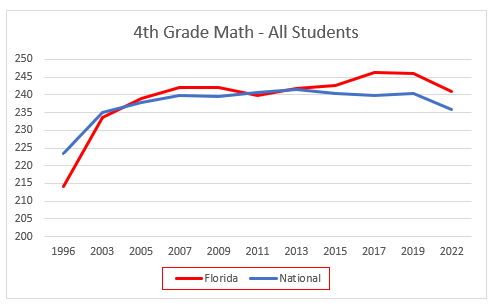 Where Florida’s fourth-grade Reading test scores dropped by an average of 0.6 points across all subgroups, students lost an average of 5.2 points in fourth-grade Math. The results were even worse for eighth graders.
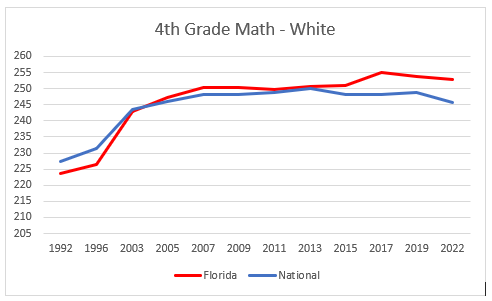
It’s worth noting that Florida’s declines in NAEP Math scores mirrored the declines seen in the national average, but that average is both richer and whiter. When adjusting for race and income, Florida tends to dominate the national rankings, while Florida’s Reading performance tops the charts.
Despite being a majority-minority state – Florida has a larger than average low-income student population – the state’s fourth-grade students beat the national average in Math. Florida’s learning loss was about the same as the national average, with students losing 5.1 points compared to a 4.6 decline nationally, the equivalent of losing about a half year of learning.
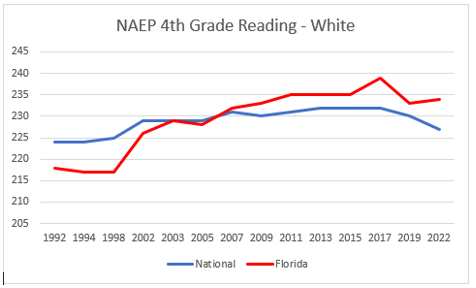
Florida’s white fourth-grade students lost 1.1 points compared to 3.1 points nationally.
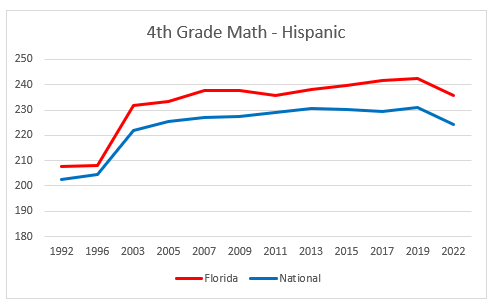
 Unlike the more uniform learning losses for Reading, Florida’s minority students saw a larger learning loss in Math than white students. Fourth-grade Hispanic students in Florida and nationally lost about the same 6.4 points compared to 6.5 points.
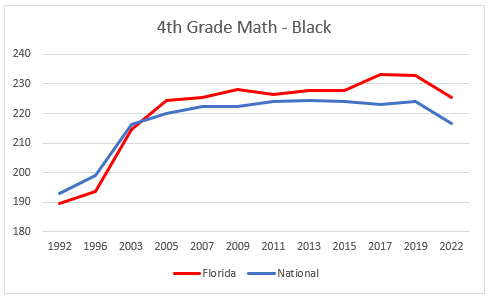
Black students in Florida lost 7.5 points compared to 7.4 points nationally. Both Black and Hispanic students lost about a half year of learning according to the fourth-grade math scores.
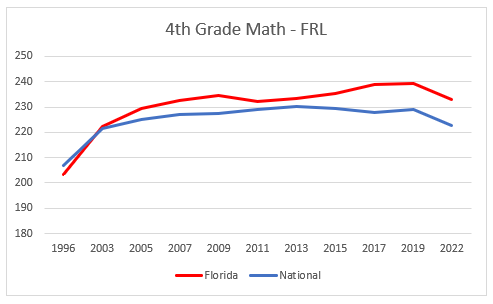
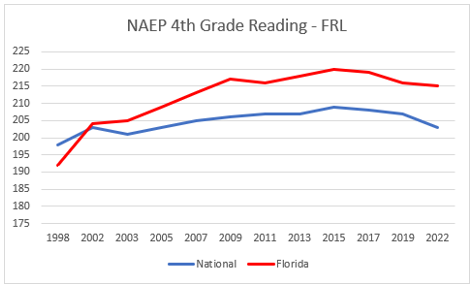
 Low-income students, defined as students eligible for free or reduced-priced lunches, saw a 6-point learning loss compared to 6.2 nationally. Overall, Florida’s low-income students still score 10 points more -- about a grade level higher -- than their counterparts nationally.
 Research shows that without a strong foundation in early grades, older students have to play catch up. That is true with Florida. The state’s overall student population is now about 3 points behind the national average.
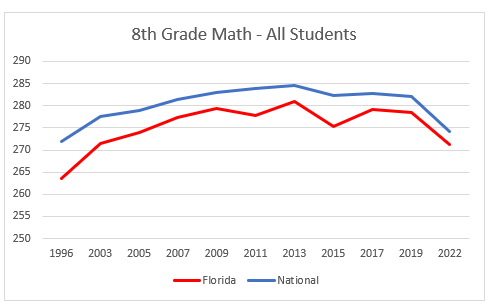 Students nationally saw a slightly larger decline at 7.7 points of learning loss compared to 7.3 points in Florida. A 7- to 8-point decline means students lost almost a year’s worth of learning between 2019 and 2022.
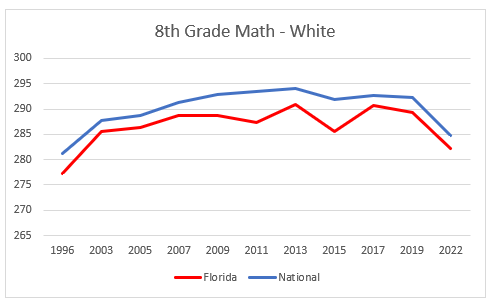
Florida’s white eighth-grade students perform below the national average in Math. Florida students saw a 7.3-point decline compared to 7.6-point decline compared to the national average.
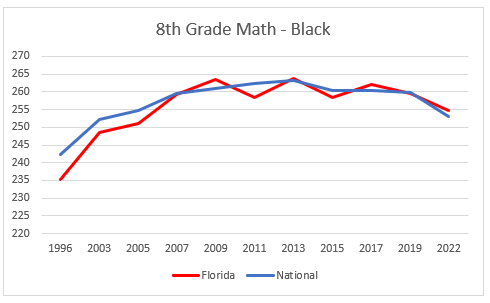
 Florida’s black students performed slightly better than their peers nationally and lost 4.6 points compared to 6.8 points nationally.
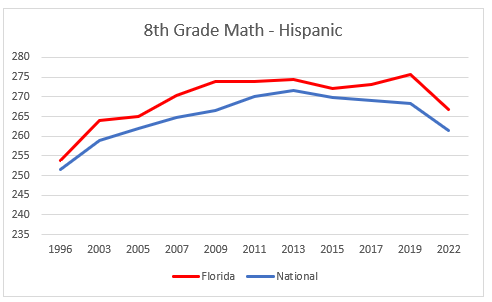
Hispanic students also performed better than their peers nationally, scoring about half a grade higher. However, Florida’s Hispanic eighth-grade student population lost 8.8 points compared to 6.8 points nationally.
 Eighth graders eligible for free or reduced-priced lunch barely edge out the national average in raw scores and in learning losses. Florida’s low-income eighth graders lost 5.6 points compared to 6.7 points nationally.
 Florida students tended to have smaller learning losses than the national average. Low-income and minority students in Florida also tended to perform better than their peers nationally.
Looking at raw scores, Florida bests the national average in 8 out of the 10 subgroups examined above. Only eighth grade students overall and eighth grade white students lose out to the national average. The national average, however, shows stronger learning gains between fourth and eighth grades.
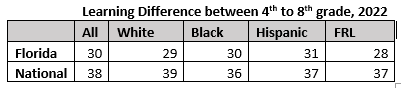 Subgroups nationally have nearly a difference of four grades in learning between fourth and eighth grade, while Florida tends to have about a three grade level difference.
Overall, viewing Florida’s fourth and eighth grade math scores confirms that the state does a great job educating students in early grades, but the rest of the nation is able to catch up by the time students reach eighth grade.
 As public school leaders began delving into the details of what went wrong following last week’s release of dismal NAEP reports, Catholic school leaders paused briefly for a victory lap before looking into how they can continue to up their game.
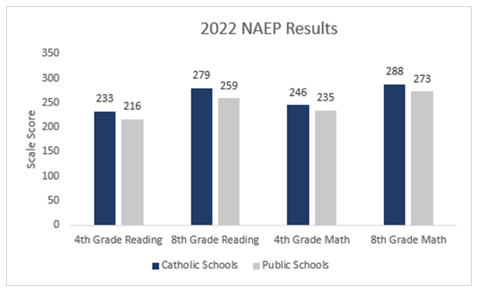
They had good reason to celebrate. Figures from the National Assessment of Education Progress, also known as the Nation’s Report Card, showed Catholic schools outperformed their public school counterparts in almost all categories.
The average score among fourth graders in Catholic schools was 233, 17 points higher than the national public school average, or about 1½ grade levels ahead. In eighth grade reading, the average score for Catholic school students was 279, 20 points higher than the national public school average, or about two grade levels ahead.
Although Catholic school students experienced a statistically significant 5-point drop in eighth grade math, Catholic school students’ average scores remained 15 points higher than the average scores of their public school eighth grade peers.
When broken down by race, Catholic schools showed significant gains since 2019. Achievement among Black students increased by 10 points (about an extra year’s worth of learning), while Black students in public schools lost 5 points.
On the eighth grade reading test, Hispanic students gained 7 points while Hispanic students in public schools lost 1 point.
Catholic schools led the nation for Hispanic achievement on each of the four tests and led the nation in Black student achievement on three of the four. They also ranked first in eighth grade reading and third in both fourth grade reading and fourth grade math for students who qualify for free and reduced-price lunch.
“Today, the divergence between Catholic schools and public ones is so great that if all U.S. Catholic schools were a state, their 1.6 million students would rank first in the nation across the NAEP reading and math tests for fourth and eighth graders,” wrote Kathleen Porter-Magee, superintendent of Partnership Schools, a management company that runs 11 Catholic schools in New York City and Cleveland.
(You can read her opinion piece in the Wall Street Journal here.)
State and local Catholic school scores were not released, but administrators praised the overall results, which they said reflected the benefits of a Catholic education.
“I’m not surprised,” said Father John Belmonte, superintendent of schools for the Diocese of Venice, which includes 16 Catholic schools in 10 Southwest Florida counties. He said while many public schools across the nation shut down for extended periods, Catholic schools remained open.
“Now you’re seeing the difference in-person education makes,” he said.
Enrollment in diocese schools was up 26% last year, with much of that due to what he called “COVID refugees” moving in from out of state to escape shutdowns. He also credited state education choice scholarship expansion, which granted automatic eligibility to children of law enforcement officers and military members
He said a common criticism of private schools is that they can be selective, while public schools must take all comers. However, the data showing that Catholic schools were near the top in learning outcomes for students receiving free and reduced-price lunch demonstrates their commitment to those who economically disadvantaged.
Chris Pastura, superintendent for the Diocese of St. Petersburg, which includes 46 schools in the Tampa Bay area, said he was “thrilled” with the results, which he reflected are a testament to how well Catholic schools handled the pandemic and their overall approach to education.
“It really underscores the power of Catholic schools and the power of education that looks to serve the whole child,” he said, adding that Catholic schools embed academics with the faith and hope that allow people to move through challenges.
Jim Rigg, superintendent of the 62 schools in the Archdiocese of Miami, was so delighted with the NAEP results that he sent a letter to teachers and staff at his schools to express his gratitude.
“We could cite many reasons for the success of our schools,” he wrote. “Catholic schools benefit from strong parent involvement, vibrant communities, and a commitment to serve the whole child. However, I know that the most important reasons our schools succeed is because of the talents, dedication and faith of our Catholic school teachers and other employees. You are our ‘secret sauce’, the real reason our schools rise above others.”
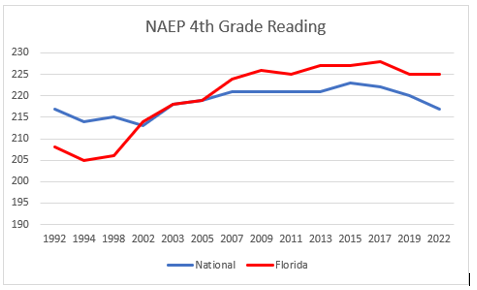
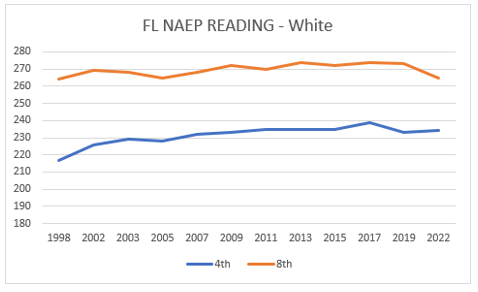
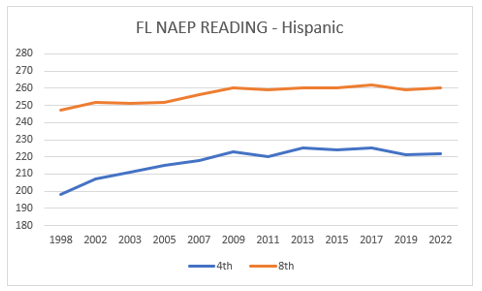
 Results from the 2022 National Assessment of Educational Progress (NAEP) aren’t pretty, but Florida does have some bright spots. The state’s students continue to excel at reading, especially when viewing the results demographically, and in particular, by free and reduced-price lunch eligibility, an indicator of poverty.
Comparing overall results isn’t entirely fair, since Florida is a majority-minority state, a term used to refer to a subdivision in which one or more racial, ethnic and/or religious minorities make up a majority of the population. Florida also has a larger than average low-income student population.
With that in mind, Florida’s fourth-grade Reading results continue to demonstrate that the Sunshine State punches above its weight, showing that the state’s efforts to improve education in elementary grades has paid dividends, allowing Florida to top the nation in NAEP rankings in those early grades no matter how you slice the data.
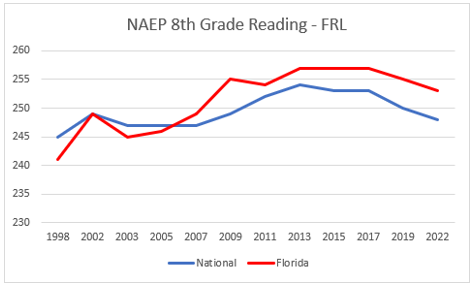
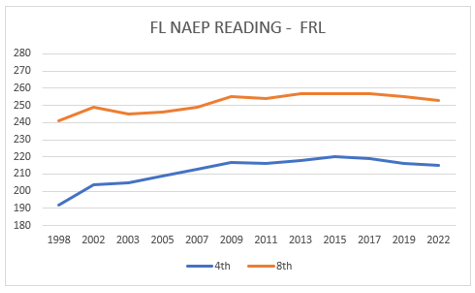
 Florida’s low-income students had a modest decline during the COVID-19 pandemic, but that decline was much smaller than the 2017-19 decline. Nationally, low-income students suffered a far more severe decline in fourth-grade Reading outcomes to the point where Florida’s students are now a grade level ahead of their counterparts.
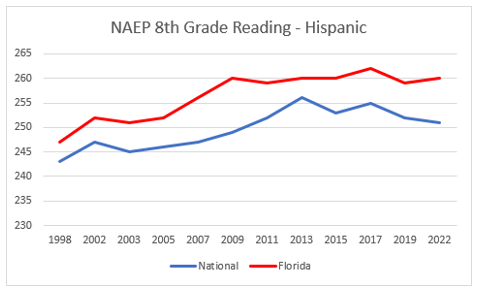
 Florida’s fourth graders didn’t suffer as badly as the rest of the nation. White and Hispanic students in fourth grade bounced back from 2019 results, while Black students saw a decline that mirrored results of the rest of the nation.
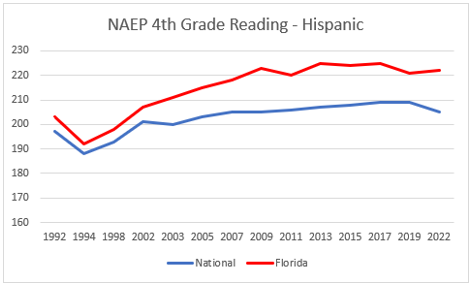
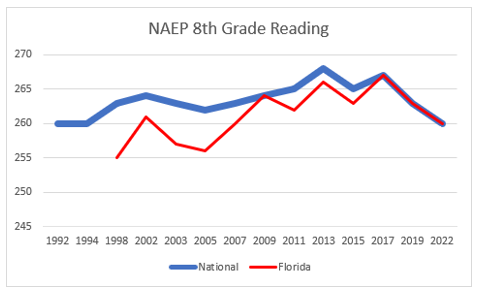
Florida’s fourth grade students are about a grade level ahead of students nationally. When adjusting for demographics and poverty, Florida ranks No. 1 in the nation for fourth grade Reading but drops to around eighth for eighth grade Reading. Without this adjustment for poverty and race, Florida’s eighth-grade Reading results appear to be just average.
Eighth grade Reading declines were sharp, but no worse than the national average. Remember, though, the national average is both whiter and wealthier than the average student in Florida.
 Low-income student performance declines mirrored the rest of the nation, but economically-disadvantaged children are still better off in Florida than in the vast majority of states.
 It’s impressive to see how big the drop was for Florida’s white eighth grade students between 2019 and 2022. Why this occurred is a mystery, but it is the driver behind Florida’s sharp (but entirely average) decline in eighth grade Reading results.
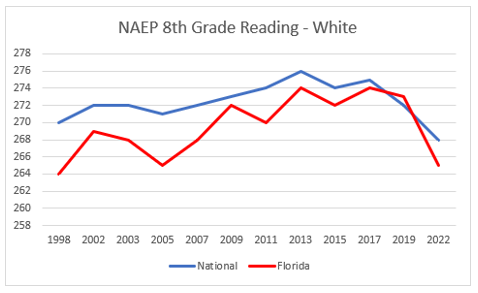 Florida’s white students saw a staggering 8-point drop from 2019, while the national average was a 4-point drop. This was far more severe than the decline for Hispanic and Black students in Florida and nationally.
 Both Black and Hispanic students continue to beat the national average on eighth grade Reading results.
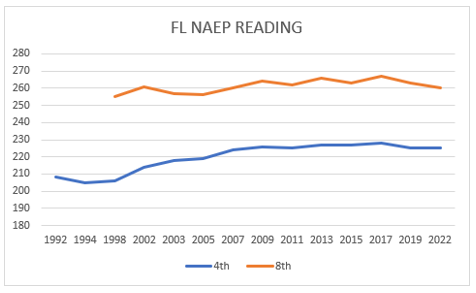
 One final point: everything learned in fourth grade is a building block for later grades. Florida’s students don’t peak in fourth grade just because the state’s results top the charts. Florida’s fourth graders are, on average, a grade level ahead of their counterparts nationally.
Without those early big gains in fourth grade, Florida’s eighth grade results would be much worse than “just average.” (And again, that “average” is compared to all incomes and races nationally, despite Florida’s status as a majority-minority state with a larger than average population of students who qualify for free or reduced-price lunch.)
Florida’s students are still getting about a year’s worth of learning in a year’s time between fourth and eighth grades. On average, Florida students gained 35 points in four years, a roughly 3.5 grade level growth.
 Low-income students gained 38 points between fourth and eighth grades, roughly four years’ worth of learning in four years’ time.
 Florida’s white students are driving underperformance by eighth grade, gaining just 31 points between fourth and eighth grades, which is about three years of learning in four years’ time.
 Florida’s Black students gained 40 points between fourth and eighth grades, meaning they gained a grade level of learning for each grade completed.
 Meanwhile, Florida’s Hispanic students gained 38 points in four years, roughly a year’s worth of learning in a year’s time for each grade.
 Coming up next week: the breakdown of the NAEP Math results.
 State-level NAEP results and Halloween both are coming soon, on Oct. 24 and Oct. 31, respectively. The first should be far more frightening than the latter.
I’m not much of a horror movie fan, but I recall watching about 3 minutes of the 1988 flick Child’s Play. I saw a psycho knife-wielding murder doll named Chucky trying to stab and bash his way past a door held shut by a terrified middle-aged woman and an equally terrified young boy.
“Give me the boy!” Chucky screamed, “GIVE ME THE BOY AND I’LL LET YOU LIVE!!!!” (You can watch the scene here, but I don’t recommend it.)
I can’t tell you what happens next, because I turned it off and tried to put it out of my mind. Nevertheless, the scene does make for a rather apt analogy for what happened during and before the COVID-19 pandemic.
The 2022 NAEP will simply serve as the latest confirmation.
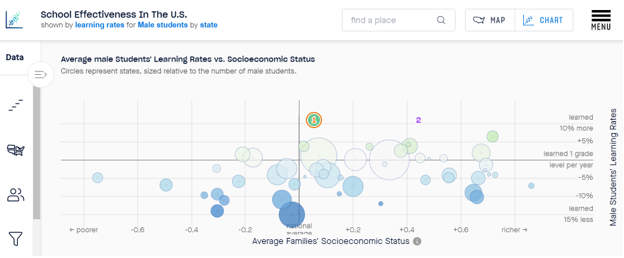
The Educational Opportunity Project at Stanford University tracked learning rates by gender and state for (currently) the 2008-18 period for grades 3-8. What you see above is the project’s scatterplot for that data.
Arizona and Alaska tied for first place with a rate of academic growth 10.9% above “learned 1 grade level per year.” Notice the large amount of blue (not good) and the relative scarcity of green.
Not to jump to any hasty conclusions, but what we are doing doesn’t seem to be working out for boys.
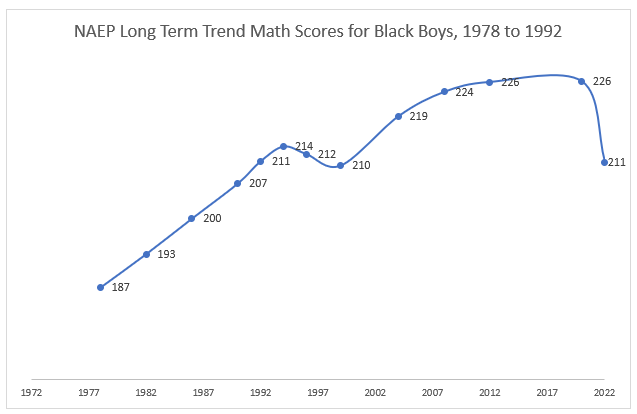
Every indicator I’ve seen thus far leads me to expect that this will look much worse when we get to the post-pandemic data. For example, in the national Long-Term Trend math NAEP data for 9-year-old Black boys, the 2022 scores rolled all the way back to 1992.
Let’s see how this looks in the state data release next week. I’m guessing the outcomes will be noticeably varied, as some jurisdictions did a much better job of holding the door than others.
Stay tuned to this channel for further updates.
 Editor’s note: This analysis of long-term scores from NAEP, which show unprecedented score declines, appeared today on The 74.
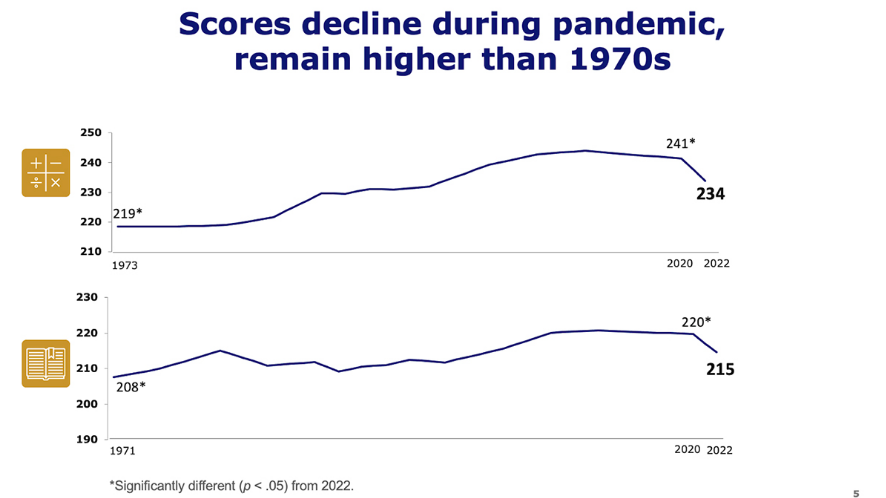
Two decades of growth for American students in reading and math were wiped away by just two years of pandemic-disrupted learning, according to national test scores released this morning.
Dismal releases from the National Assessment of Educational Progress (NAEP) — often referred to as the “nation’s report card” — have become a biannual tradition in recent years as academic progress first stalled, then eroded for both fourth and eighth graders. But today’s publication, tracking long-term academic trends for nine-year-olds from the 1970s to the present, includes the first federal assessment of how learning was affected by COVID-19.
The picture it offers is bleak. In a special data collection combining scores from early 2020, just before schools began to close, with additional results from the winter of 2022, the report shows average long-term math performance falling for the first time ever; in reading, scores saw the biggest drop in 30 years.
And in another familiar development, the declines were much larger for students at lower performance levels, widening already-huge learning disparities between the country’s high- and low-achievers.
The results somewhat mirror last fall’s release of scores for 13-year-olds, which also revealed unprecedented learning reversals on the long-term exam. But that data was only collected through the fall of 2019; the latest evidence shows further harm sustained by younger students in the following years.
Peggy Carr, commissioner of the National Center for Education Statistics, said on a call with reporters that the “sobering” findings illustrated the learning losses inflicted by prolonged school closures and student dislocation.
“It’s clear that COVID-19 shocked American education and stunned the academic growth of this age group of students,” Carr said. “We don’t make this statement lightly.”
To continue reading, click here.
 Editor’s note: This article on this week's release of NAEP scores appeared Thursday on The 74.
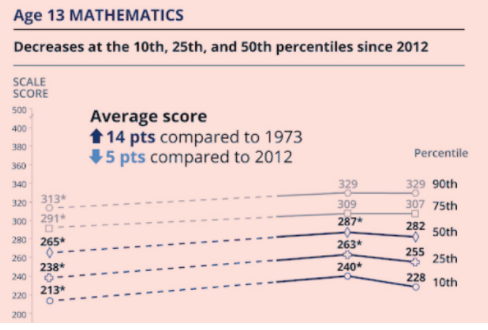
Thirteen-year-olds saw unprecedented declines in both reading and math between 2012 and 2020, according to scores released this morning from the National Assessment of Educational Progress (NAEP).
Consistent with several years of previous data, the results point to a clear and widening cleavage between America’s highest- and lowest-performing students and raise urgent questions about how to reverse prolonged academic stagnation.
The scores offer more discouraging evidence from NAEP, often referred to as “the Nation’s Report Card.” Various iterations of the exam, each tracking different subjects and age groups over several years, have now shown flat or falling numbers.
The latest release comes from NAEP’s 2020 assessment of long-term trends, which was administered by the National Center for Education Statistics to nine- and 13-year-olds before COVID-19 first shuttered schools last spring. In a Wednesday media call, NCES Commissioner Peggy Carr told reporters that 13-year-olds had never before seen declines on the assessment, and the results were so startling that she had her staff double-check the results.
“I asked them to go back and check because I wanted to be sure,” Carr recalled. “I’ve been reporting these results for…decades, and I’ve never reported a decline like this.”
The eight-year gap between 2020’s exam and its predecessor, in 2012, is the longest interval that has ever passed between successive rounds of the long-term trend assessment; a round that was originally scheduled for 2016 was nixed for budgetary reasons. Given the length of time between exams and the general trend of increasing scores over multiple decades, observers could have expected to see at least some upward movement.
To continue reading, click here.
 The science results on The Nation’s Report Card are out, and while the news isn’t all bad, it isn’t great either.
Scores for fourth- grade students have declined from the 2015 peak while scores for eighth- and 12th-grade science students have remained flat over the last decade.
The National Assessment of Education Progress (NAEP) is administered to a random sample of students across public, private and charter schools. NAEP tests are given in reading, math and science every few years. For the 2019 NAEP science exam, 88,200 students in grades 4, 8 and 12 took the test.
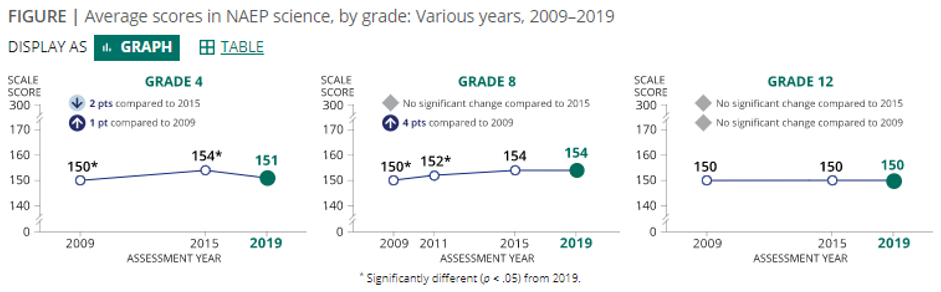 On the three science tests, there was no difference in results between 2019 and 2015 on physical science across all grades. However, fourth-grade students scored 4 points lower on life science and 2 points lower on earth and space sciences compared with 2015. There was no difference in results for life or earth science in the eighth- or 12th-grade results.
There is some encouraging news.
Demographic changes show America is drifting toward a majority-minority student population. Overall, white students declined from 60% of the student population taking the science exam in 2009 to 52% in 2019. Hispanic students grew from 17% to 25%, though Black students declined from 15% to 13%.
Impressively, Hispanic students saw a positive trend line throughout the decade in all three tested grade levels. Asian and Pacific Islander students scored the highest at 51% and 49% proficient or better, respectively.
The number of students eligible for free and reduced-price meals, who typically score significantly lower than non-eligible students, has increased from 40% of tested students in 2009 to 47% in 2019. However, 48% of test takers were eligible in 2015 when the test results were highest.
Now for the bad news.
Just 35% of students scored proficient or better in the science tests. Of them, only 14% of Black students and 20% of Hispanic students scored proficient or better. White students saw the largest declines between 2015 and 2019, with 47% of students scoring proficient or better, down from 50% in 2015.
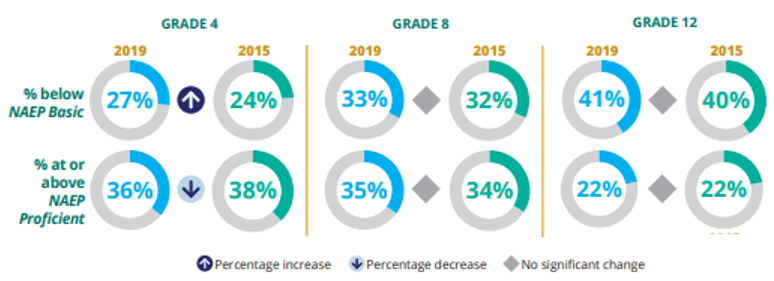 Despite no change in raw scores for students in eighth grade or 12th grade, the percentage of those students scoring proficient or better remains low, especially among high school seniors. The number of students who scored proficient or better declined from 36% in fourth grade to 22% in 12th grade.
So why are fewer than 1 in 4 seniors proficient in science?
A NAEP survey found that 50% of 12th-grade students reported rarely engaging in scientific activities in the classroom, compared with 30% in fourth grade and 42% in eighth grade.
Additionally, only 41% of 12th-graders have taken courses in biology, chemistry and physics since the eighth grade.
Both factors may be playing a large role in 12th-graders’ struggles to be proficient in science.
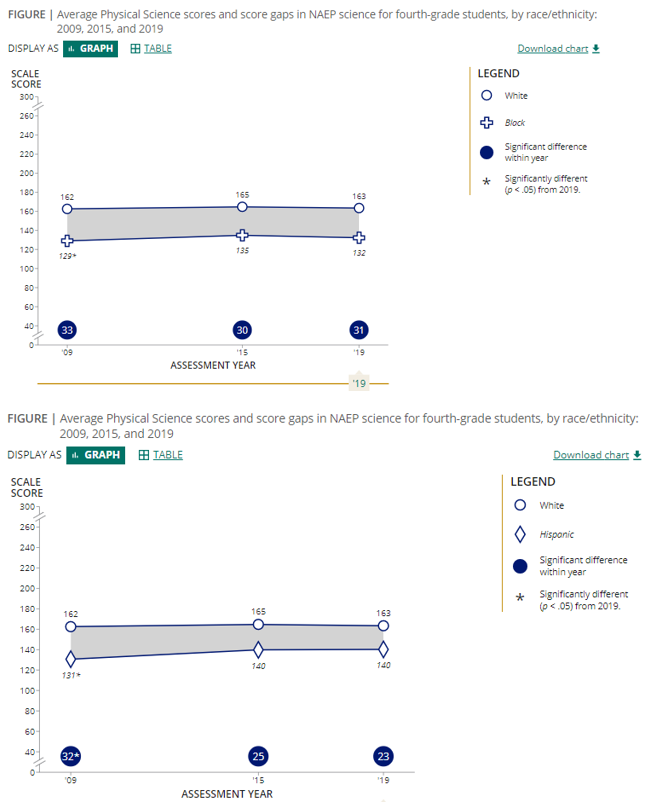
Large achievement gaps between white and Black students and white and Hispanic students still remain. The gap between white and Black students grew from 31 points in fourth grade to 34 points by eighth-grade. The gap between white and Hispanic students grow from 23 points in fourth grade to 25 points in 12th grade.
However, this gap is an improvement over the 2015 results because white students saw larger score declines than Hispanic students in the fourth and 12th grade science tests.
According to the report, the declines were driven by drops in scores among middle-performing students and the lowest-performing students. Students at the 50th percentile saw an average decline of 2 points. But the lowest-performing students saw the biggest declines. Students in the 25th percentile (meaning they scored as good as or better than 25% of students taking the test) declined 4 points, while students in the 10th percentile droped 5 points.
These low-performing fourth-grade students struggled across all three tests, with life science declining the most between 2015 and 2019. The lowest-perorming students also did worse compared to 2015 in eighth-grade physical science, eighth-grade life science, eighth-grade earth science, 12th grade physical science and 12th grade life science.
There is no defense for the latest blemish on Florida’s school accountability system. And it’s incumbent upon those who have built and supported that system to quickly acknowledge oversight and management issues within the state Department of Education and ensure the proper steps are taken for a fix.
After the problems with the state writing test in May, it’s hard to believe what has now been widely reported: The state got more than 200 school grades wrong, evidently because it forgot to calculate one of the new elements in its revised grading formula. With all due respect to the hard-working, well-intentioned people in DOE, that’s a bit maddening. To make matters worse, the state announced the grade changes in a press release, emailed after 10 p.m. Friday, that didn’t own up to errors but instead referred to “preliminary revisions” discovered during a “continuous review process.”
A state that has rightly set a high bar for its schools, its students and its teachers obviously has to set a high bar for its own piece of the education bureaucracy. Florida’s education leaders have given more than lip service to terms like “data driven” and “evidence based” and “no excuses.” But in this case, the data isn’t right. And the evidence suggests that honest mistake is no longer a credible excuse.
Critics are using this mishap to shore up their call for a roll-back of Florida’s ed reforms. What a shame for Florida’s kids if they succeed. Standardized tests and school grades are imperfect tools. But in Florida, they’ve been used effectively to put a bigger spotlight and more focus on student achievement, particularly for low-income and minority kids. For years now, one credible, independent analysis after another has found Florida students in the national vanguard in terms of academic progress. Three positive reports have surfaced in the past six weeks alone (see here, here and here).
It’s not fair that DOE’s successes are overlooked and its mistakes amplified. It’s not fair that its critics are held to a lower standard. But this is the environment that Florida’s ed reformers live in, and it’s not likely to change any time soon. At the end of the day, they should continue to be guided by the evidence, no matter how much it is ignored by critics. Or, in this case, how much it points to their own shortcomings.