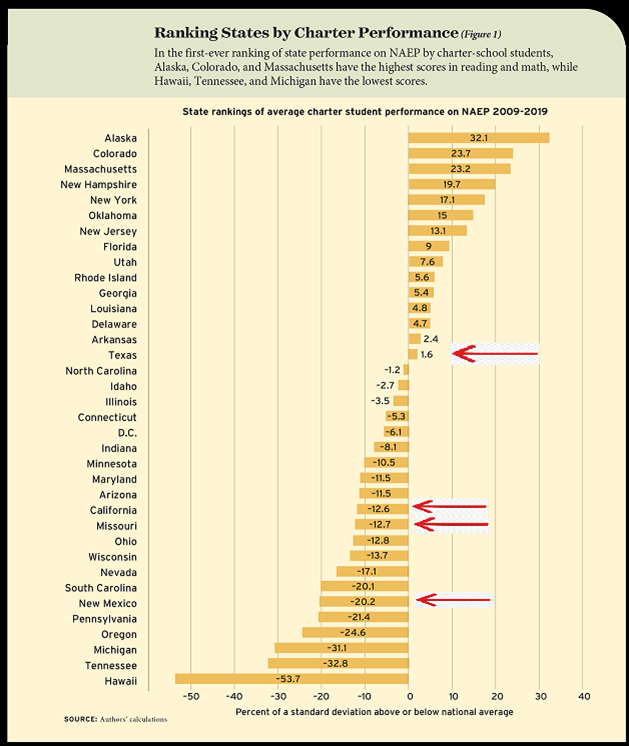
Paul E. Peterson and M. Danish Shakeel recently published a ranking of state charter school sectors based upon their NAEP 4th and 8th grade proficiency rates between 2009 and 2019. An outcome based ranking, rather than one for instance based upon a technocratic beauty pageant, is highly desirable. The methods employed in this article, however, can be refined to more accurately reflect average charter school quality by state sector.
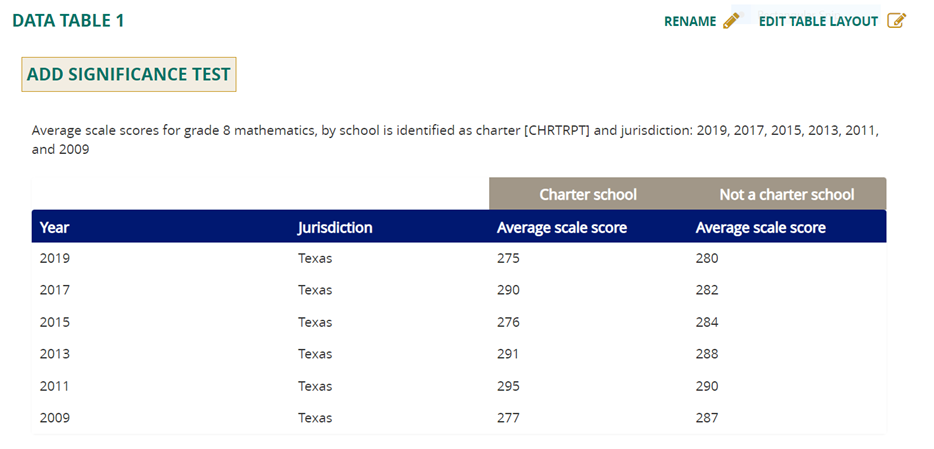
Peterson and Shakeel utilized NAEP 4th and 8th grade Reading and Math scores for charter sectors between 2009 and 2019 as the basis for their analysis. NAEP tests representative samples of students in each state, but subgroup scores can bounce around suspiciously from exam to exam. For example, take a look at 8th grade mathematics scores for charter school students and district students in Texas between 2009 and 2019:

Did Texas charter school students really suffer a grade and a half drop in mathematics ability between 2017 and 2019, or alternatively did something goofy happen with the sample? Hard to be sure, but the much larger Texas district sample demonstrates a great deal more stability over time. In six exams, Texas charter schools landed in the 270s three times, in the 290s three other times. How much of this reflects actual variation in performance and how much of this variation is statistical noise? Hard to say.
Perhaps sampling errors cancel each other out in the big picture, and perhaps they do not. Let’s proceed as if they do. Peterson and Shakeel also attempted to statistically control for the student demographics of the students in charter sectors. Given the strong correlation between student demographics and proficiency rates, this desire is entirely appropriate. The authors, however, were unable to control for the rates of special education and English Language Learner status. As a quick check I decided to single out the four states bordering Mexico (Arizona, California, New Mexico and Texas) to see if it appeared the inability to control for rates of students identified as ELL may have influenced rankings. None of the states performed well in the overall proficiency rankings, with Texas ranking highest of the four with a “meh.”

Might there be a better way to develop an outcome-based ranking of state charter sectors? The Stanford Educational Opportunity Project would seem to serve as a better source of data for such a project. Unlike NAEP, the Stanford data draws from a much broader universe of schools (and charter schools) and thus is less prone to sampling error. Another improvement involves the fact that Stanford includes a measure of academic growth which is delightfully nowhere near as strongly correlated with student demographics as proficiency rates.
Academic growth is widely thought to be the best measure of school quality. While Peterson and Shakeel rank the four border state charter sectors as meh to sub-meh based upon NAEP subgroup scores with potentially dodgy sampling and incomplete demographic controls, Stanford’s Educational Opportunity Project data shows very strong academic growth for charter schools in all four border states.
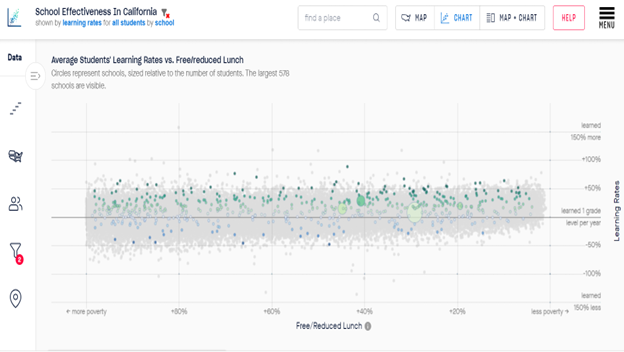
Here for instance is a chart from the Stanford website showing rates of academic growth for California charter schools, each dot is a school and green dots above the center line signify an average rate of academic growth higher than “learned one grade level per year” in Grades 3-8 between 2008 and 2018.

If one conceives of the job of a school to start with a child wherever their academics lie and get them learning, California charter schools look magnificent. Peterson and Shakeel’s effort to rank state charter sectors based on outcomes is laudable, but their choice of data and outcomes could profit from refinement.


