Harvard University’s Paul Peterson and M. Danish Shakeel wrote a response to a critique of their Charter School Report Card. The authors note that I misinterpreted their study in saying that they did not control for English language learners and special education students, but they in fact did control for those factors. I will take the “L” on that and offer the authors my apologies. However, I want to explain a bit further why I believe we should approach NAEP estimates for state charter school sectors with skepticism.
NAEP is highly used and respected, and accordingly, I used to be an enthusiast for examining NAEP charter school data. However, I received a caution from a former state NAEP director that those estimates were far less than reliable. The claim went as follows: drawing a statewide representative sample of students does not ensure that you will get a representative sample of charter school students. My first reaction to this challenge was something along the lines of, “In theory, every student in the state has the same probability of being tested, and this should produce generally reliable estimates with a known amount of measurement error.” Theory is the keyword here; practice can be messy. I was told, in effect, that state charter estimates can swing wildly from test to test based on which charter schools were included and excluded from testing sample to testing sample.
Given that my source has a lot more hands-on knowledge of NAEP sampling than me, I decided to eyeball the data. For example, the percentage of Asian students (4.9%) is smaller even than the percentage of charter school students (7.9%). In theory, Asian students should be more difficult to reliably sample than charter school students. In practice, Asian scores look much more stable than charter school students:
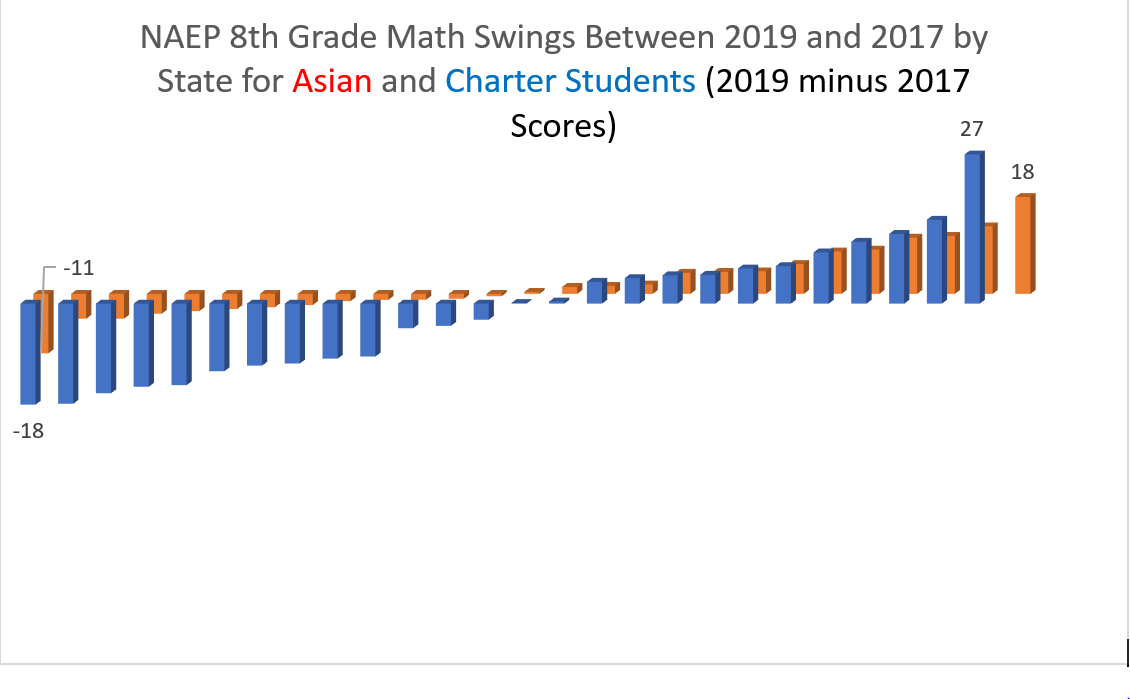 Does anyone else find it a bit implausible to think that South Carolina charter school students experienced a 27-point improvement between 2017 and 2019? South Carolina charter schools also notched a 29-point increase in their eighth grade reading scores between 2017 and 2019, which was four times larger than the largest increase in an Asian score in a state. Maybe South Carolina charter students were living right, or just maybe something odd is going on in the sampling. In any case all this bouncing around led me to believe that my former state NAEP director source knew of what they spoke.
Peterson and Shakeel note, "By combining results from 24 tests over an 11-year period, the chances of obtaining reliable results are greatly enhanced.” I agree with this, but don’t find it necessarily assuring. While pooling is a good idea, as random errors can cancel out, there is no guarantee that they will do so. For example, in 2016, the “poll of polls” approach predicted a thumping Hillary Clinton electoral college victory relying upon a similar pooling approach. If you poll a group of noisy estimates, it is possible that the result will be noise.
In my original post, I offered the opinion that Stanford’s Educational Opportunity Project data would be a better source of data due to two large advantages. First, the Stanford data, by linking state testing data across the country, contains a much larger universe of schools and students over a continuous 10-year period. Second, the Stanford data includes a measure of academic growth, which is not possible with NAEP. Scholars widely regard academic growth as the best measure of school quality.
Peterson and Shakeel’s rankings put California’s charter sector in the bottom half of their ranking (25th out of 36 state sectors). If we go to the Stanford data and examine the growth data of California charter schools, it looks like this. (Green dots represent high-growth schools, and blue dots represent growth schools.)
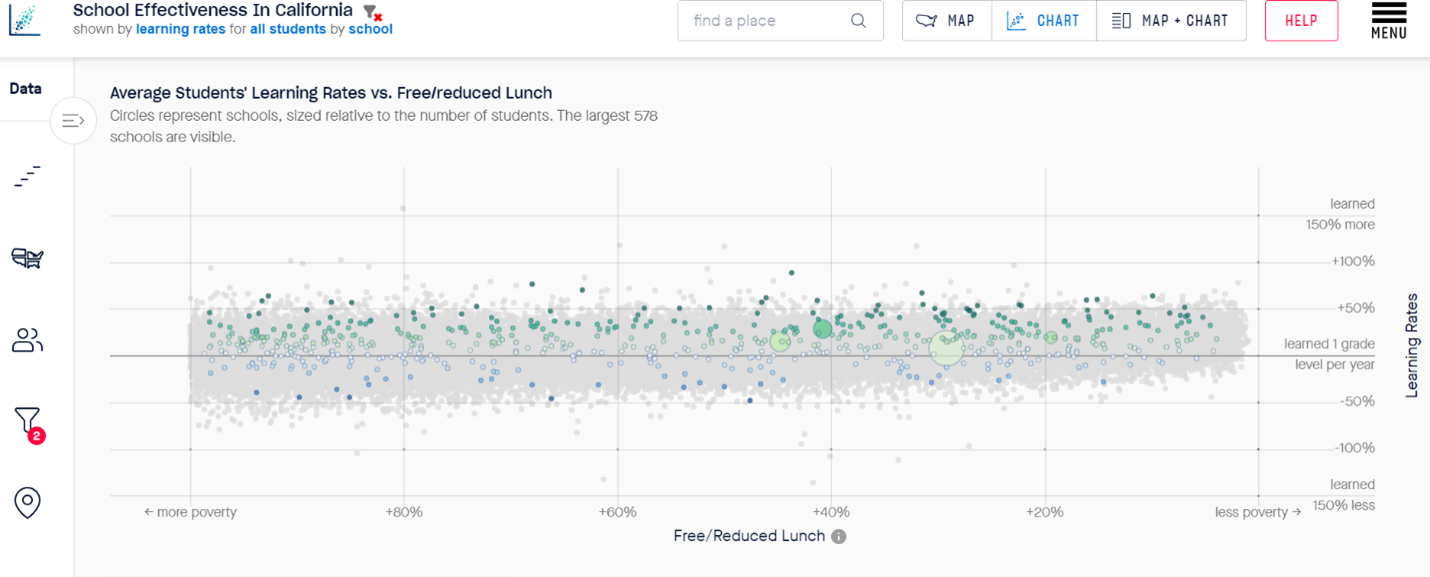
Does California have a high-quality or low-quality charter sector? The answer might hinge on whether you want to place your trust in the modeling of noisy NAEP estimates or alternatively trust your own lying eyes. I’m inclined to go with the eyeball test.
Peterson and Shakeel, however, are not sold on the superiority of the Stanford data. “But Ladner would have us use the problematic SEDA test data because SEDA reports changes in student performance in each school district and charter school from one year to the next. That requires yet another assumption: that there is no change in the composition of a school cohort from one year to the next, a particularly strong assumption for a school of choice.”
Stanford’s data may be “problematic” but that seems like a weighty charge. My claim is not that NAEP data is generally problematic, merely that their estimates for charter students are very noisy, which was a claim brought to my attention by a knowledgeable source and which I investigated. There of course is a change in the composition of the charter sector school cohort form one year to the next and the same is true of the district school system. If this is a systemic issue, I don’t believe there is any reason to suspect that NAEP is any more immune to it than the Stanford data.
I commend Peterson and Shakeel for creating an outcome-based measure of charter school sectors. I think it is an important topic and worthy of discussion and debate as to which measurers of academic achievement and which data sources should be used.